COMPARISON DRAFT · 2026-10-13
M31 profiles and the Milky Way foreground along our sightlines
The 14 primary data points measure the combined cool line-of-sight component, CGMsum = MW + M31. They are not a separated M31 measurement. We use the saved absorbed 0.5–2.0 keV surface brightnesses and local-covariance statistical errors.
Compare the native sample masses first, then inspect conditional mass scaling. The third figure uses the actual projected minor-axis coordinate. Every curve is a conditional template; no arbitrary MW pedestal was fitted and no new spectral fit or component decomposition was performed.
The added Milky Way comparison uses Galactic latitude b and angular separation from the Galactic centre, psi, for the same fields and retains the previously audited MW sightline predictions. Foreground gas is distributed along each sightline, so an observed brightness has no unique three-dimensional Galactocentric radius.
01 · NATIVE SAMPLE MASSES
Distinguish revisions from population differences
The upper panel compares the historical Zhang MW-mass v1 model, the final v3 model, and the intrinsic beta-model posterior table supplied by the author on 2026-10-08. The lower panel compares the Zhang v3 M31-mass bin with the He & Li v2 full and high-mass samples. The same CGMsum measurements appear in every panel.
The author table is for MW-mass galaxies. Its blue band contains the pointwise 16th–84th percentiles of 500 posterior model curves, not galaxy-to-galaxy scatter or a full radial covariance. Log-log PCHIP interpolates the 5, 15, 25… kpc grid. The v1 curve is historical context.
The intrinsic He & Li curves are approximate representative reconstructions from the marginal rc, beta, and rounded log L(10–200 kpc) in v2 Table 1. They are not exact author best-fit curves. The main fitting interval is 10–50 kpc; downloadable values beyond 50 kpc are flagged as extrapolation.
The inner radial coverage differs by source. Section 2.2 of Zhang v3 lists native bins beginning at 0–10, 10–30 and 30–50 kpc. The 5 kpc entry in the updated author table is an intrinsic-model evaluation, not an additional independently resolved measurement. The innermost data point in He & Li Figure 4 is at roughly 1–2 kpc, but the CGM fit mainly uses 10–50 kpc; stellar emission is important closer to the centre.
Each side is plotted out to 40 kpc. Analytic beta models with published parameters extend to 0 kpc, with dotted lines below 10 kpc marking inward model continuation. For He & Li this lies outside the main fitting range. Although the central Zhang bin covers 0–10 kpc, finer structure within it still comes from the model rather than independently resolved measurements. The author posterior table is shown only over 5–40 kpc; neither the curve nor its uncertainty band is extrapolated into 0–5 kpc.
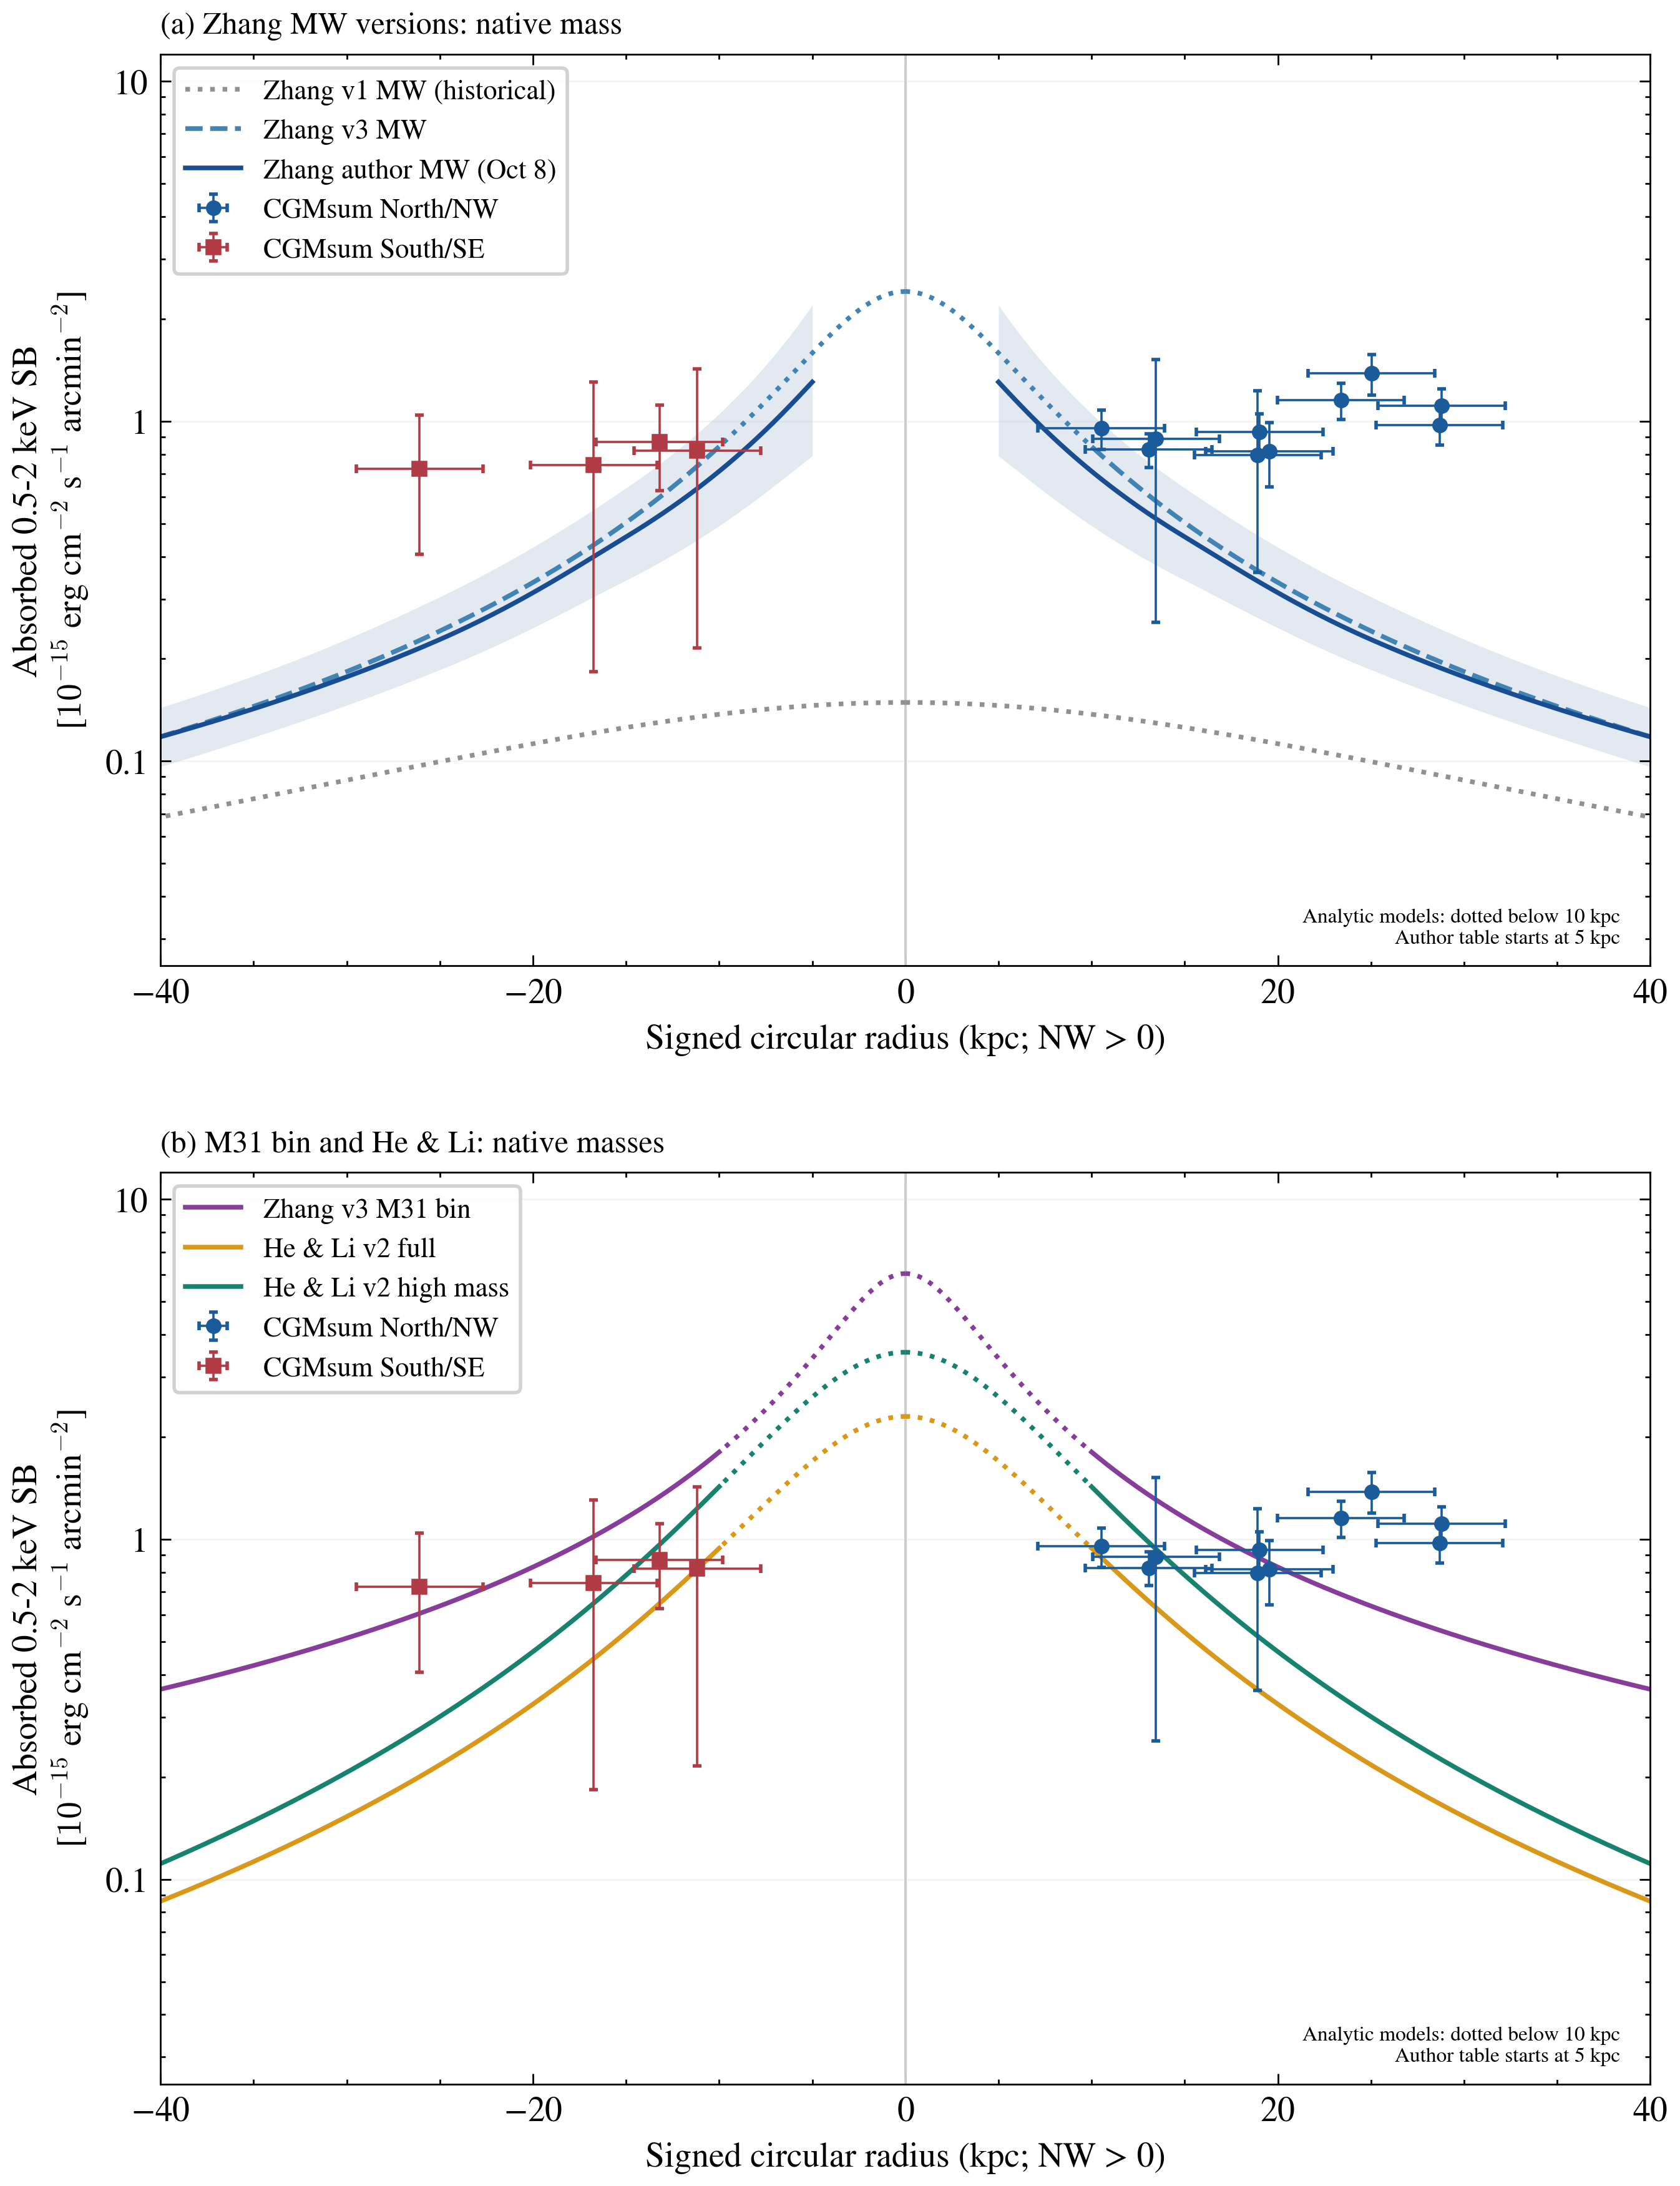
Native sample masses, without mass rescaling. The signed circular projected radius is retained from the measurement table: NW positive, SE negative. Vertical bars are local-covariance statistical errors. Horizontal extents show a nominal 15-arcmin field radius, not statistical errors or exact masks. Templates use a fixed NH; the observed spectra used their individual HI4PI columns. Analytic curves are dotted over 0–10 kpc; the author table begins at 5 kpc.

02 · CONDITIONAL MASS SCALING
Normalization depends on the sample and its weights
The upper panel multiplies each template by (1.3×10^11 solar masses / median stellar mass)^2.4 at fixed physical radius. The target is the Zhang M31-bin median, not a new stellar-mass measurement for M31. The native Zhang M31 curve is unchanged. Observed data are never rescaled.
The exponent 2.4 describes luminosity integrated within R500c. Applying it to surface brightness at every fixed radius requires an additional common-shape assumption. Halo radii are not dilated and stellar-mass calibrations are not homogenized. These curves are not measurements from a mass-matched re-stack.
The lower panel adds a He & Li sensitivity calculation with equal galaxy weights: target_mass^2.4 / mean(stellar_mass^2.4). Actual radial stacking weights are unknown. This is neither a preferred correction nor a confidence interval; the difference illustrates the dependence on mass distribution and weighting.
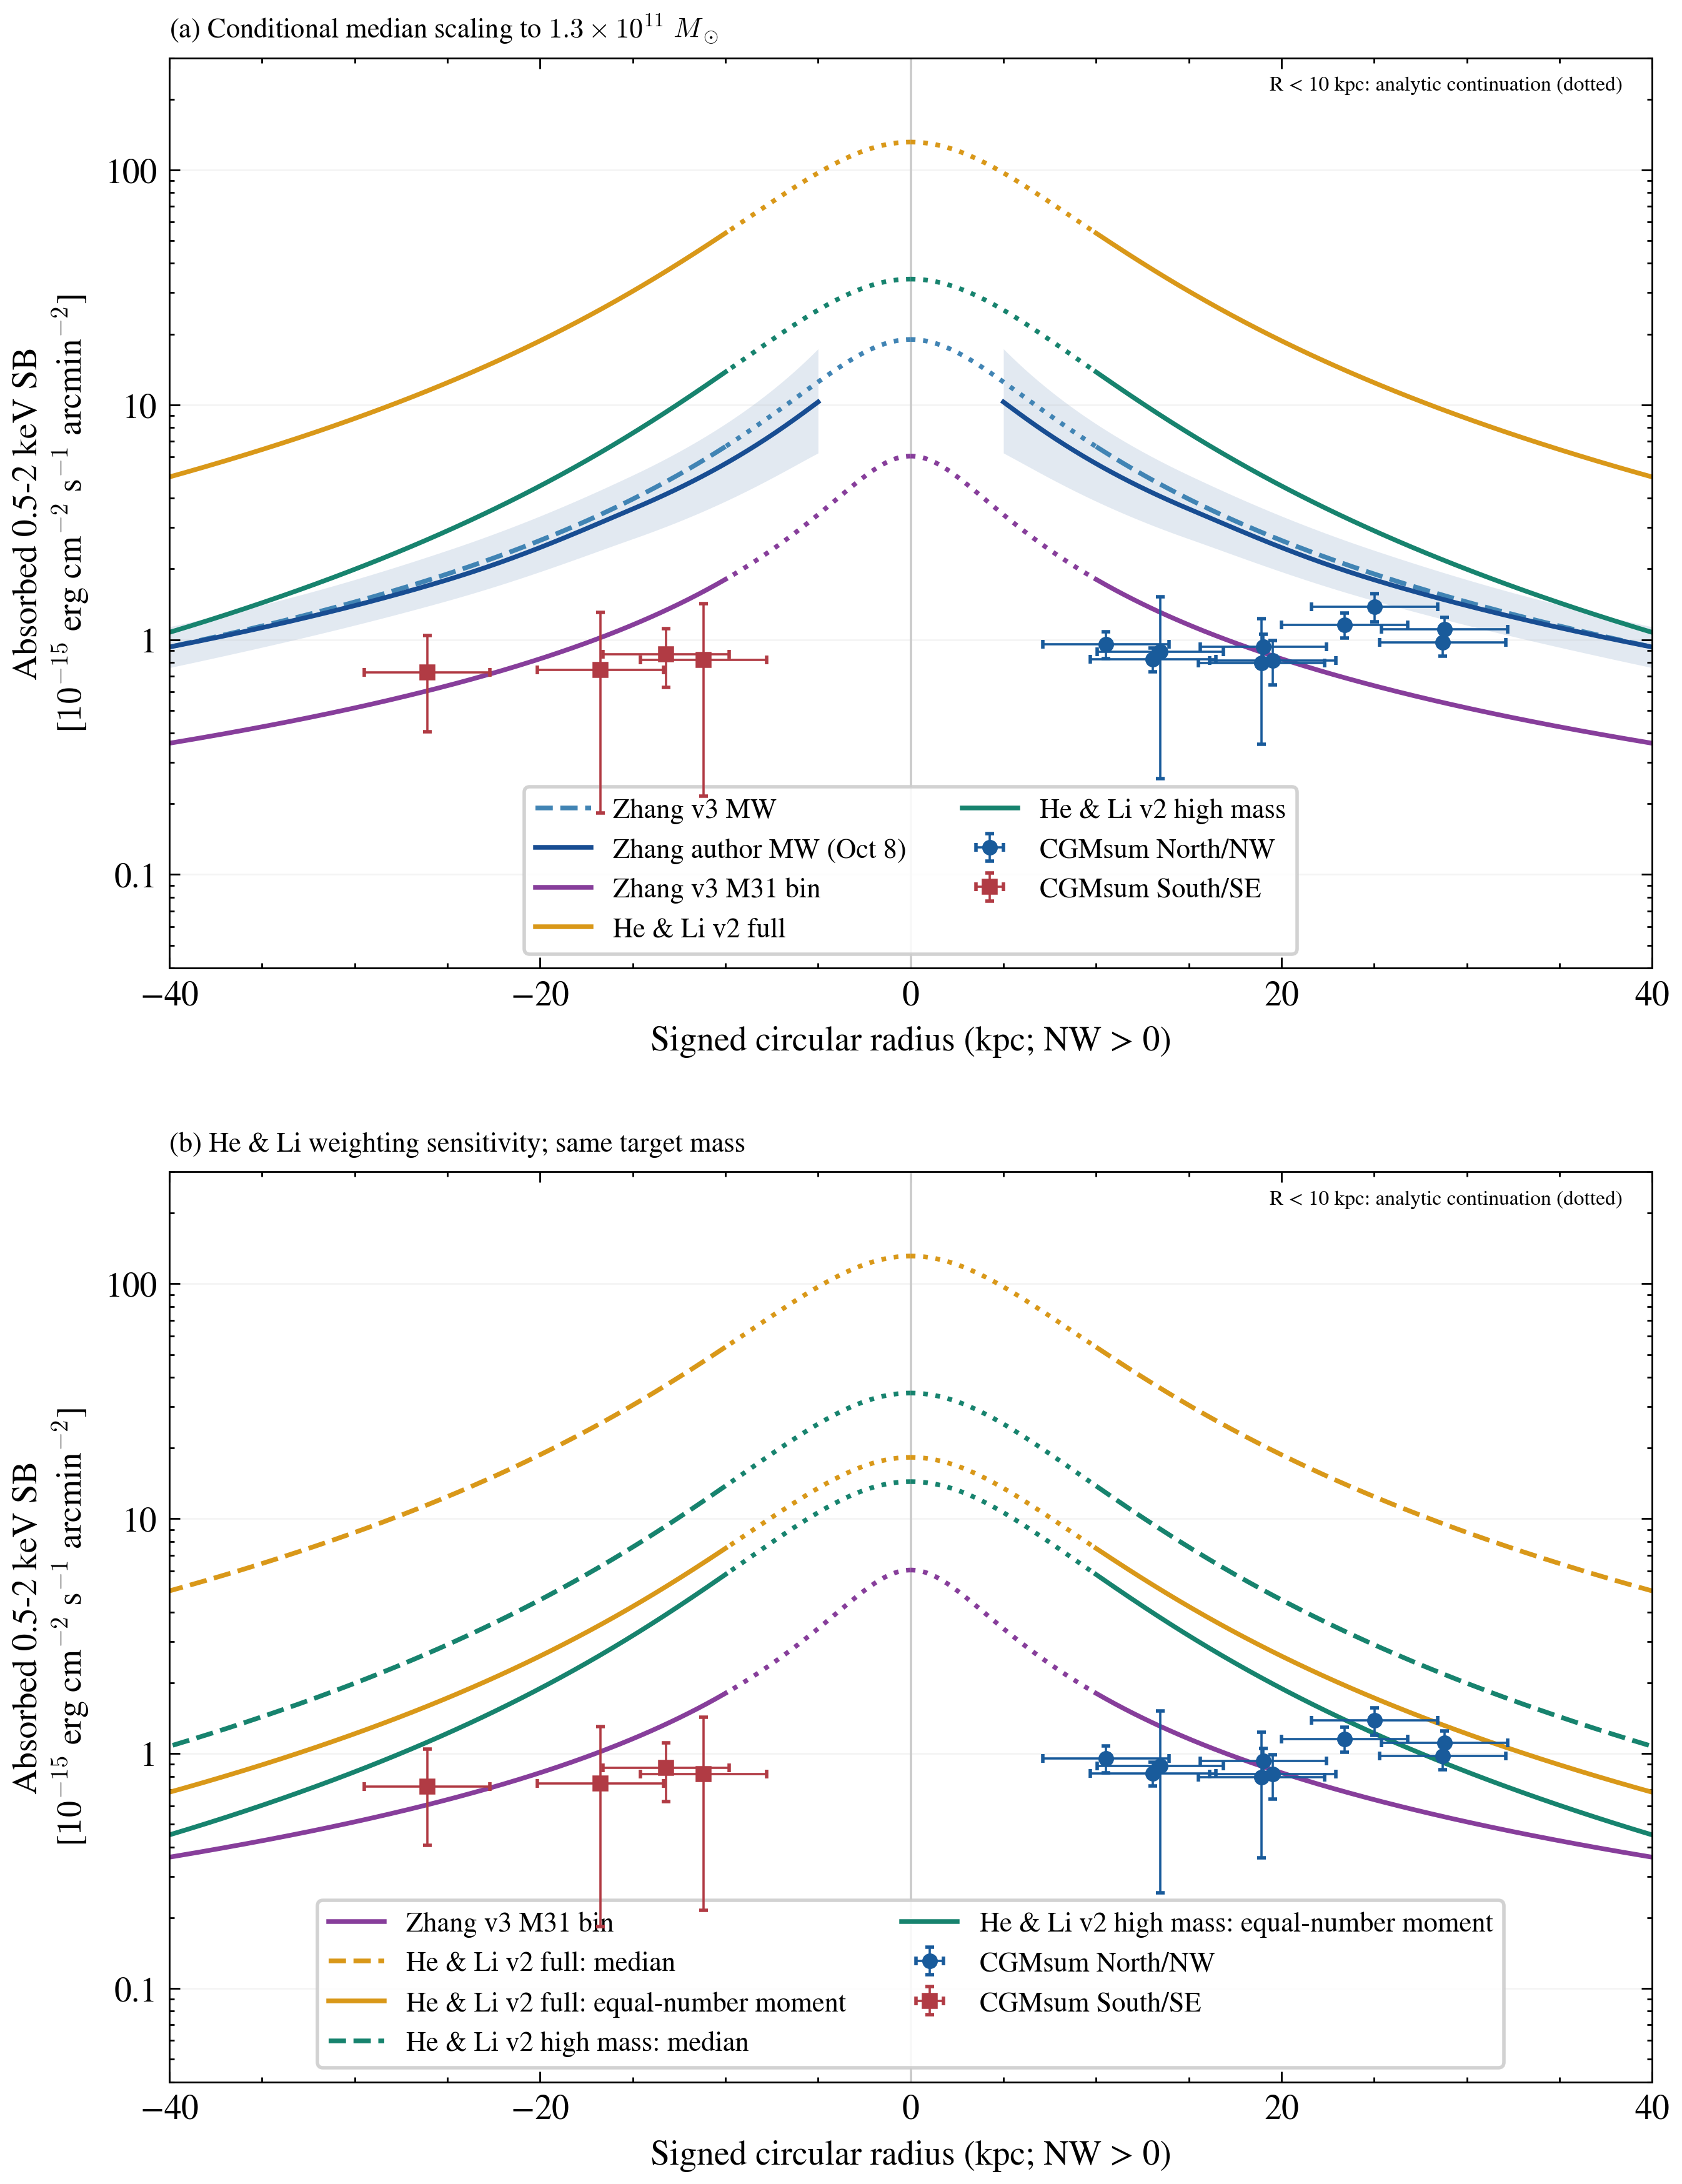
The same CGMsum data with conditional mass scaling. Top: median-mass factors. Bottom: He & Li median factors (dashed) and equal-number mass-moment illustrations (solid). The author band propagates only its pointwise interval, without mass-scaling or spectral systematics. This display does not establish a model-exclusion significance. All analytic curves use dotted lines below 10 kpc to mark inward model continuation; the author table still begins at 5 kpc.

| Template | Median M★ / 10^10 solar masses | rc / kpc | Beta | Median factor | Equal-number moment factor |
|---|---|---|---|---|---|
| Zhang v1 MW (historical) | 5.5 | 30.0 | 0.42 | 7.88 | — |
| Zhang v3 MW | 5.5 | 6.0 | 0.43 | 7.88 | — |
| Zhang author MW (Oct 8) | 5.5 | posterior | posterior | 7.88 | — |
| Zhang v3 M31 bin | 13 | 4.0 | 0.37 | 1 | — |
| He & Li v2 full | 2.41 | 8.7 | 0.52 | 57.2 | 7.94 |
| He & Li v2 high mass | 5.05 | 9.1 | 0.55 | 9.66 | 4.05 |
03 · VERTICAL DIRECTION
Use the actual minor-axis position and the correct model radius
We use a TAN projection about M31 with D=780 kpc and major-axis PA=37.3 degrees east of north. The projected minor coordinate is positive toward NW. It is a sky-plane coordinate, not a deprojected gas height above the disk.
Each model cross is evaluated at that field’s circular projected radius Rproj and displayed at its actual minor-axis coordinate. Fields are not assumed to lie exactly on the minor axis, and absolute minor-axis distance does not replace Rproj.
Predictions are fixed-NH field-center values, not integrals over source masks, effective area, and response. Saved circular radii are preserved; new minor-axis coordinates adopt 780 kpc. The two radius conventions differ by less than one percent.
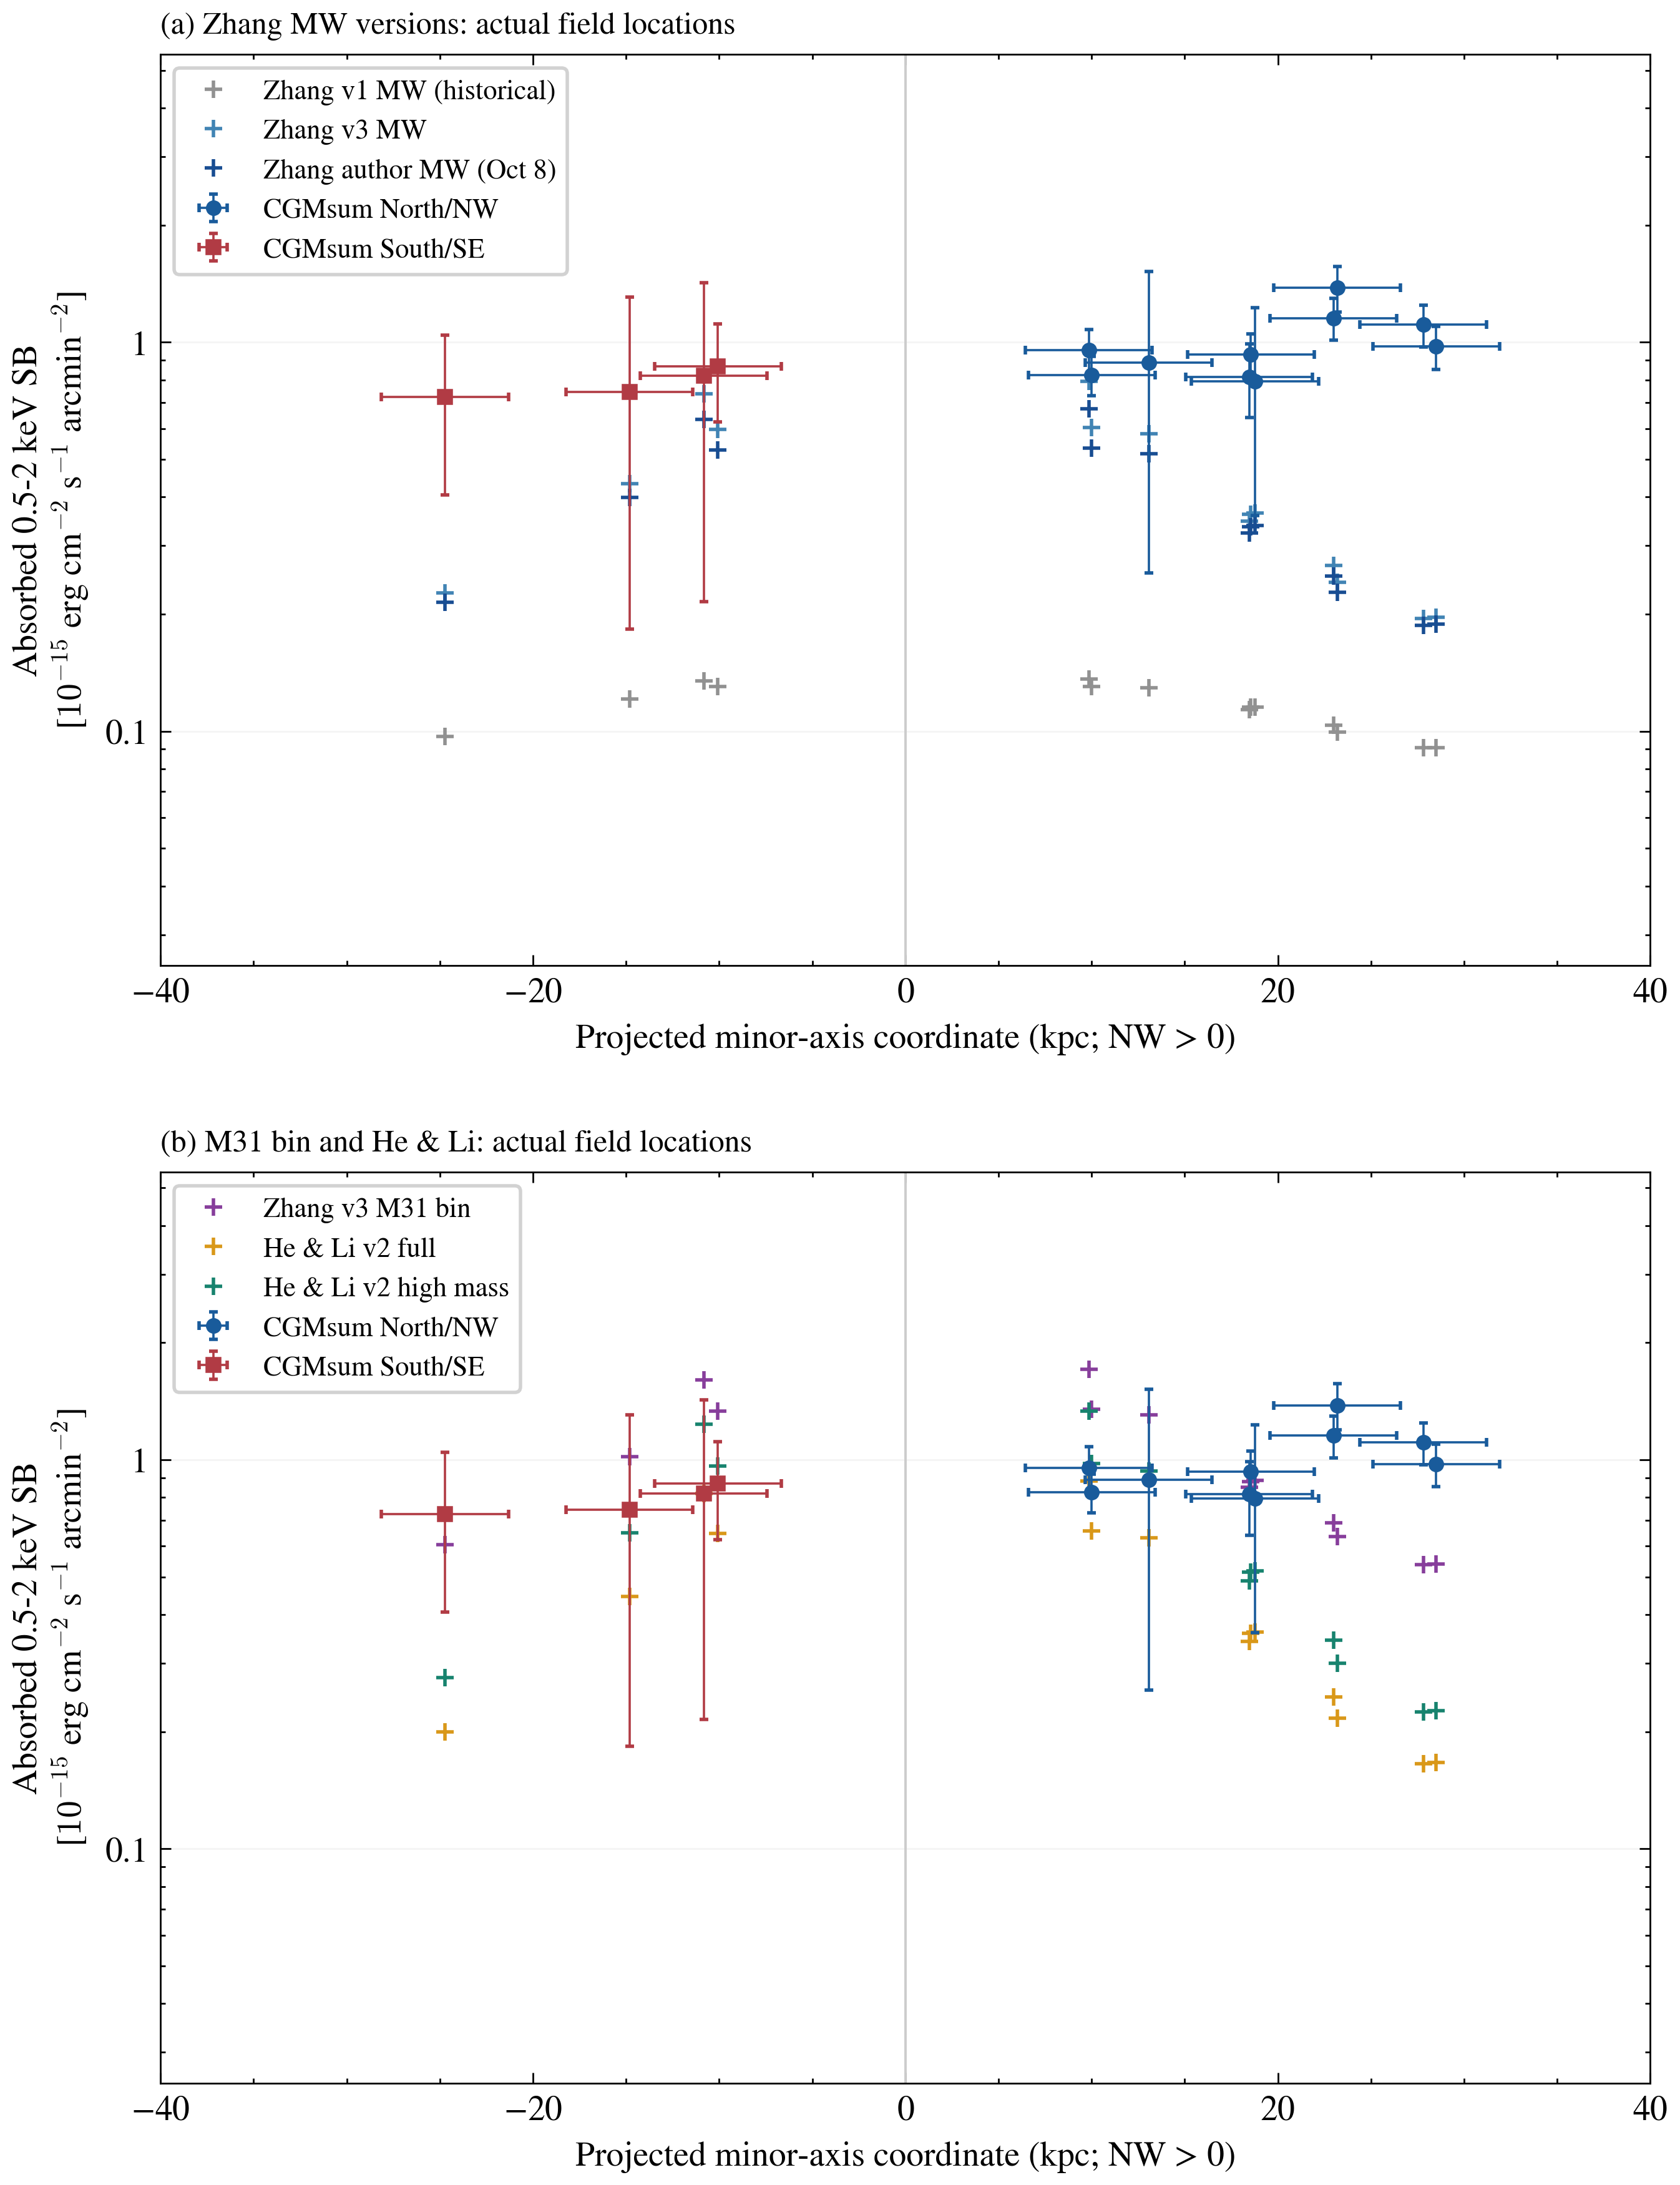
Observed data and native-mass templates at the actual projected minor-axis positions. Crosses are model evaluations at each field’s Rproj, not additional measurements. They are not joined into an artificial continuous vertical profile.

04 · FIELD GEOMETRY
The two chains do not form a complete annulus
The rings mark circular projected radii of 10, 20, and 30 kpc. Colored circles illustrate nominal 15-arcmin field radii, without actual camera boundaries or source masks. The NW/SE groups contain 14 fields in total.
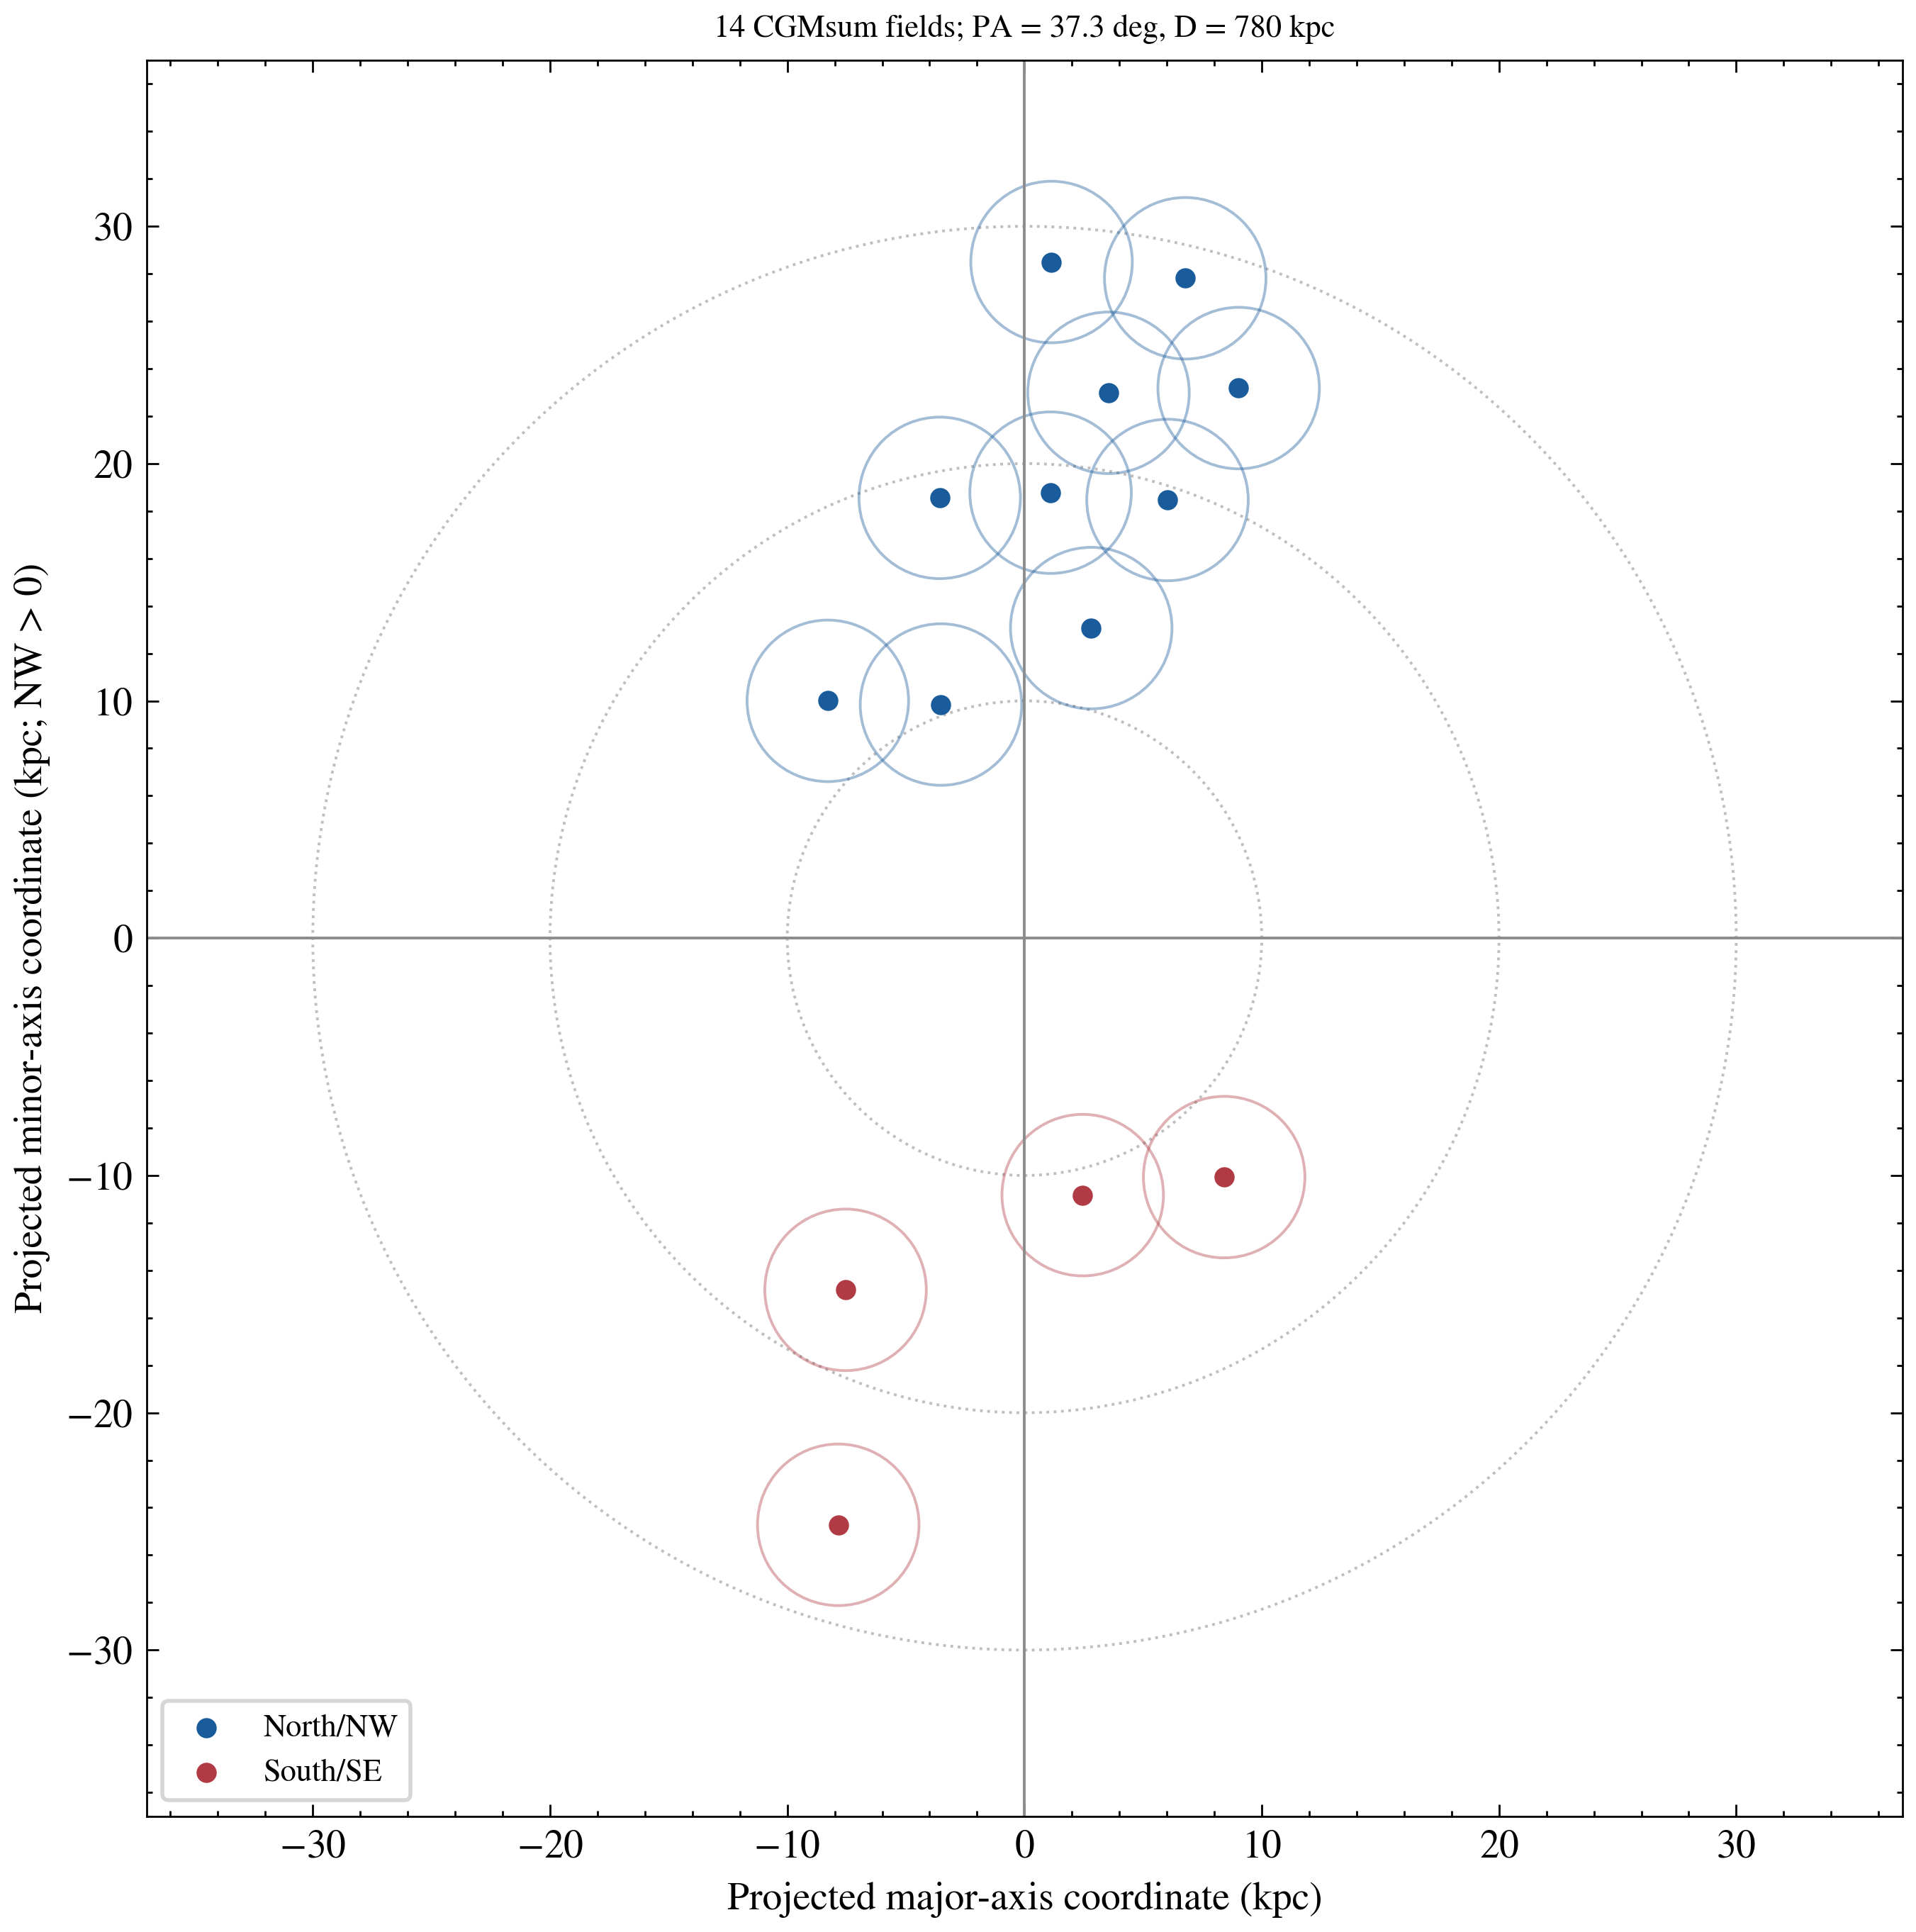
Sky-plane geometry of the same measurements. Offsets from the minor axis explain why circular projected radius and the vertical coordinate are not interchangeable.

05 · MW coordinates
Compare Milky Way models in the observer’s sky coordinates first
Disk-like or flattened MW gas is usually described by n(R,z). Galactic latitude b is a useful display coordinate while retaining each field’s actual longitude l and NH. A spherical halo n(r) predicts brightness integrated from the Solar position along a sightline; a useful sky coordinate is psi=acos[cos b cos l], the angular separation from the ideal Galactic-centre direction (l,b)=(0,0), in degrees. Psi is not the gas’s Galactocentric distance in kpc.
With the Sun at R_sun=8.2 kpc and z_sun=0, and distance s>=0 along the sightline, r(s)^2=R_sun^2+s^2−2 R_sun s cos b cos l. Disk models additionally use R(s)^2=R_sun^2+(s cos b)^2−2 R_sun s cos b cos l and z(s)=s sin b. Our 14 fields span l=119.51–122.30 deg, b=−23.17 to −19.89 deg and psi=117.54–119.72 deg, all looking outward from the Galactic centre. The minimum Galactocentric radius on each forward ray is therefore 8.2 kpc; the infinite-line tangent point lies behind the Sun, so R_sun sin(psi) cannot be assigned as the gas distance.
The crosses retain the previously audited nominal per-field predictions from the Locatelli reference, Ueda disk and HaloSat combined models, including each study’s temperature, abundance and spectral conversion and each field’s HI4PI NH, in absorbed 0.5–2 keV units. Nothing was refitted or forced to 0.175 keV. Locatelli is extrapolated from its western-sky fit and HaloSat from its b<−30 deg fit domain; the Ueda fields lie within the adopted angular selection. These are field-centre sightline integrations, not integrations over the actual masked camera footprints. No unsupported posterior bands are drawn, and predictions at different l and NH are not connected as a universal b-only profile.
The second figure places the 86 convertible high-latitude detections from Henley & Shelton beside our lower-latitude fields in the same absorbed energy band. This is detection-selected population context, not a foreground prior toward M31 or a universal latitude model. The eFEDS spectrum comes from another sky patch and likewise should not become a horizontal profile across the whole b axis.
A coordinate change offers another view without adding independent observations. Our span is only about 3.3 deg in b and 2.2 deg in psi, over which the MW predictions vary little; local normalization and patchiness are generally more consequential than global profile shape. Density or absorption-column models n(r) and N(O VII) must first predict the corresponding sightline emission, S proportional to the integral of n_e n_H Lambda[T,Z] along s, including absorption, before being compared with these brightness measurements.
Locatelli et al. 2024 · Ueda et al. 2022 · Kaaret et al. 2020 / HaloSat · Henley & Shelton 2013
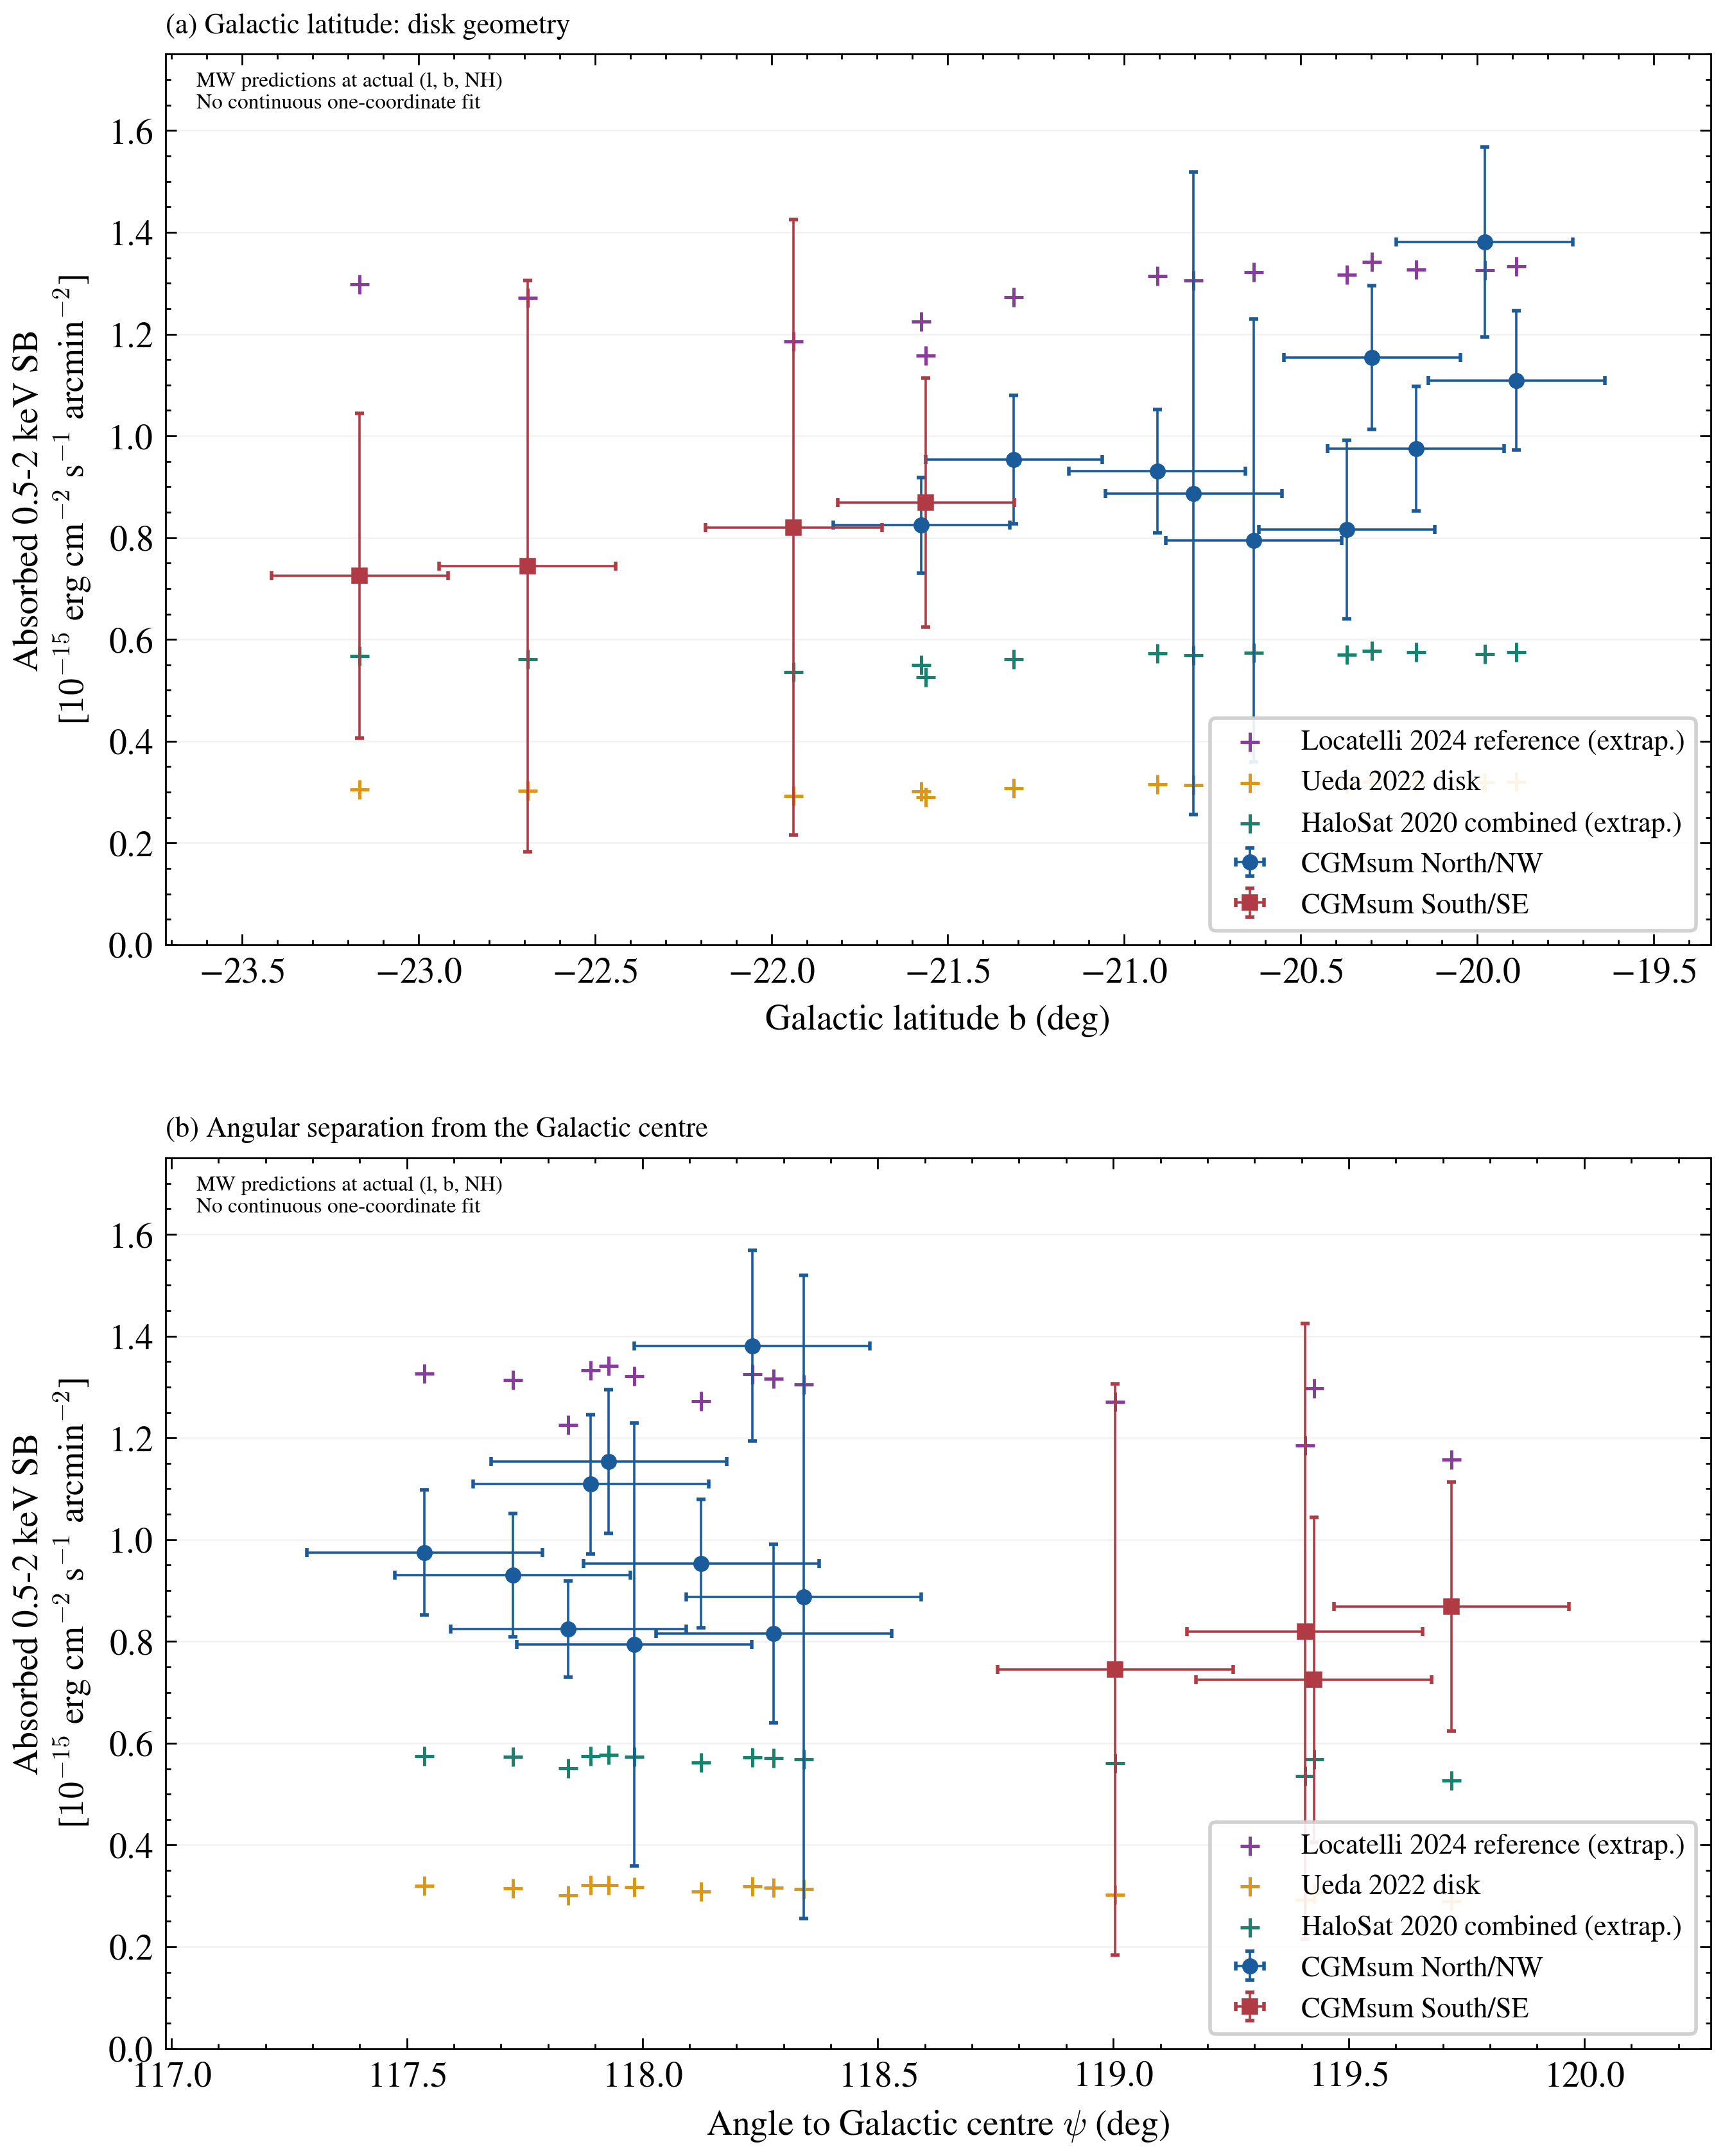
The same MW+M31 CGMsum measurements displayed against Galactic latitude b and angular separation from the Galactic centre, psi. Crosses are nominal predictions of three existing MW models at the actual (l,b,NH), not independent measurements. Horizontal bars indicate only the nominal 15 arcmin field radius. Each model retains its original spectral transfer and appropriate internal-MW geometry.

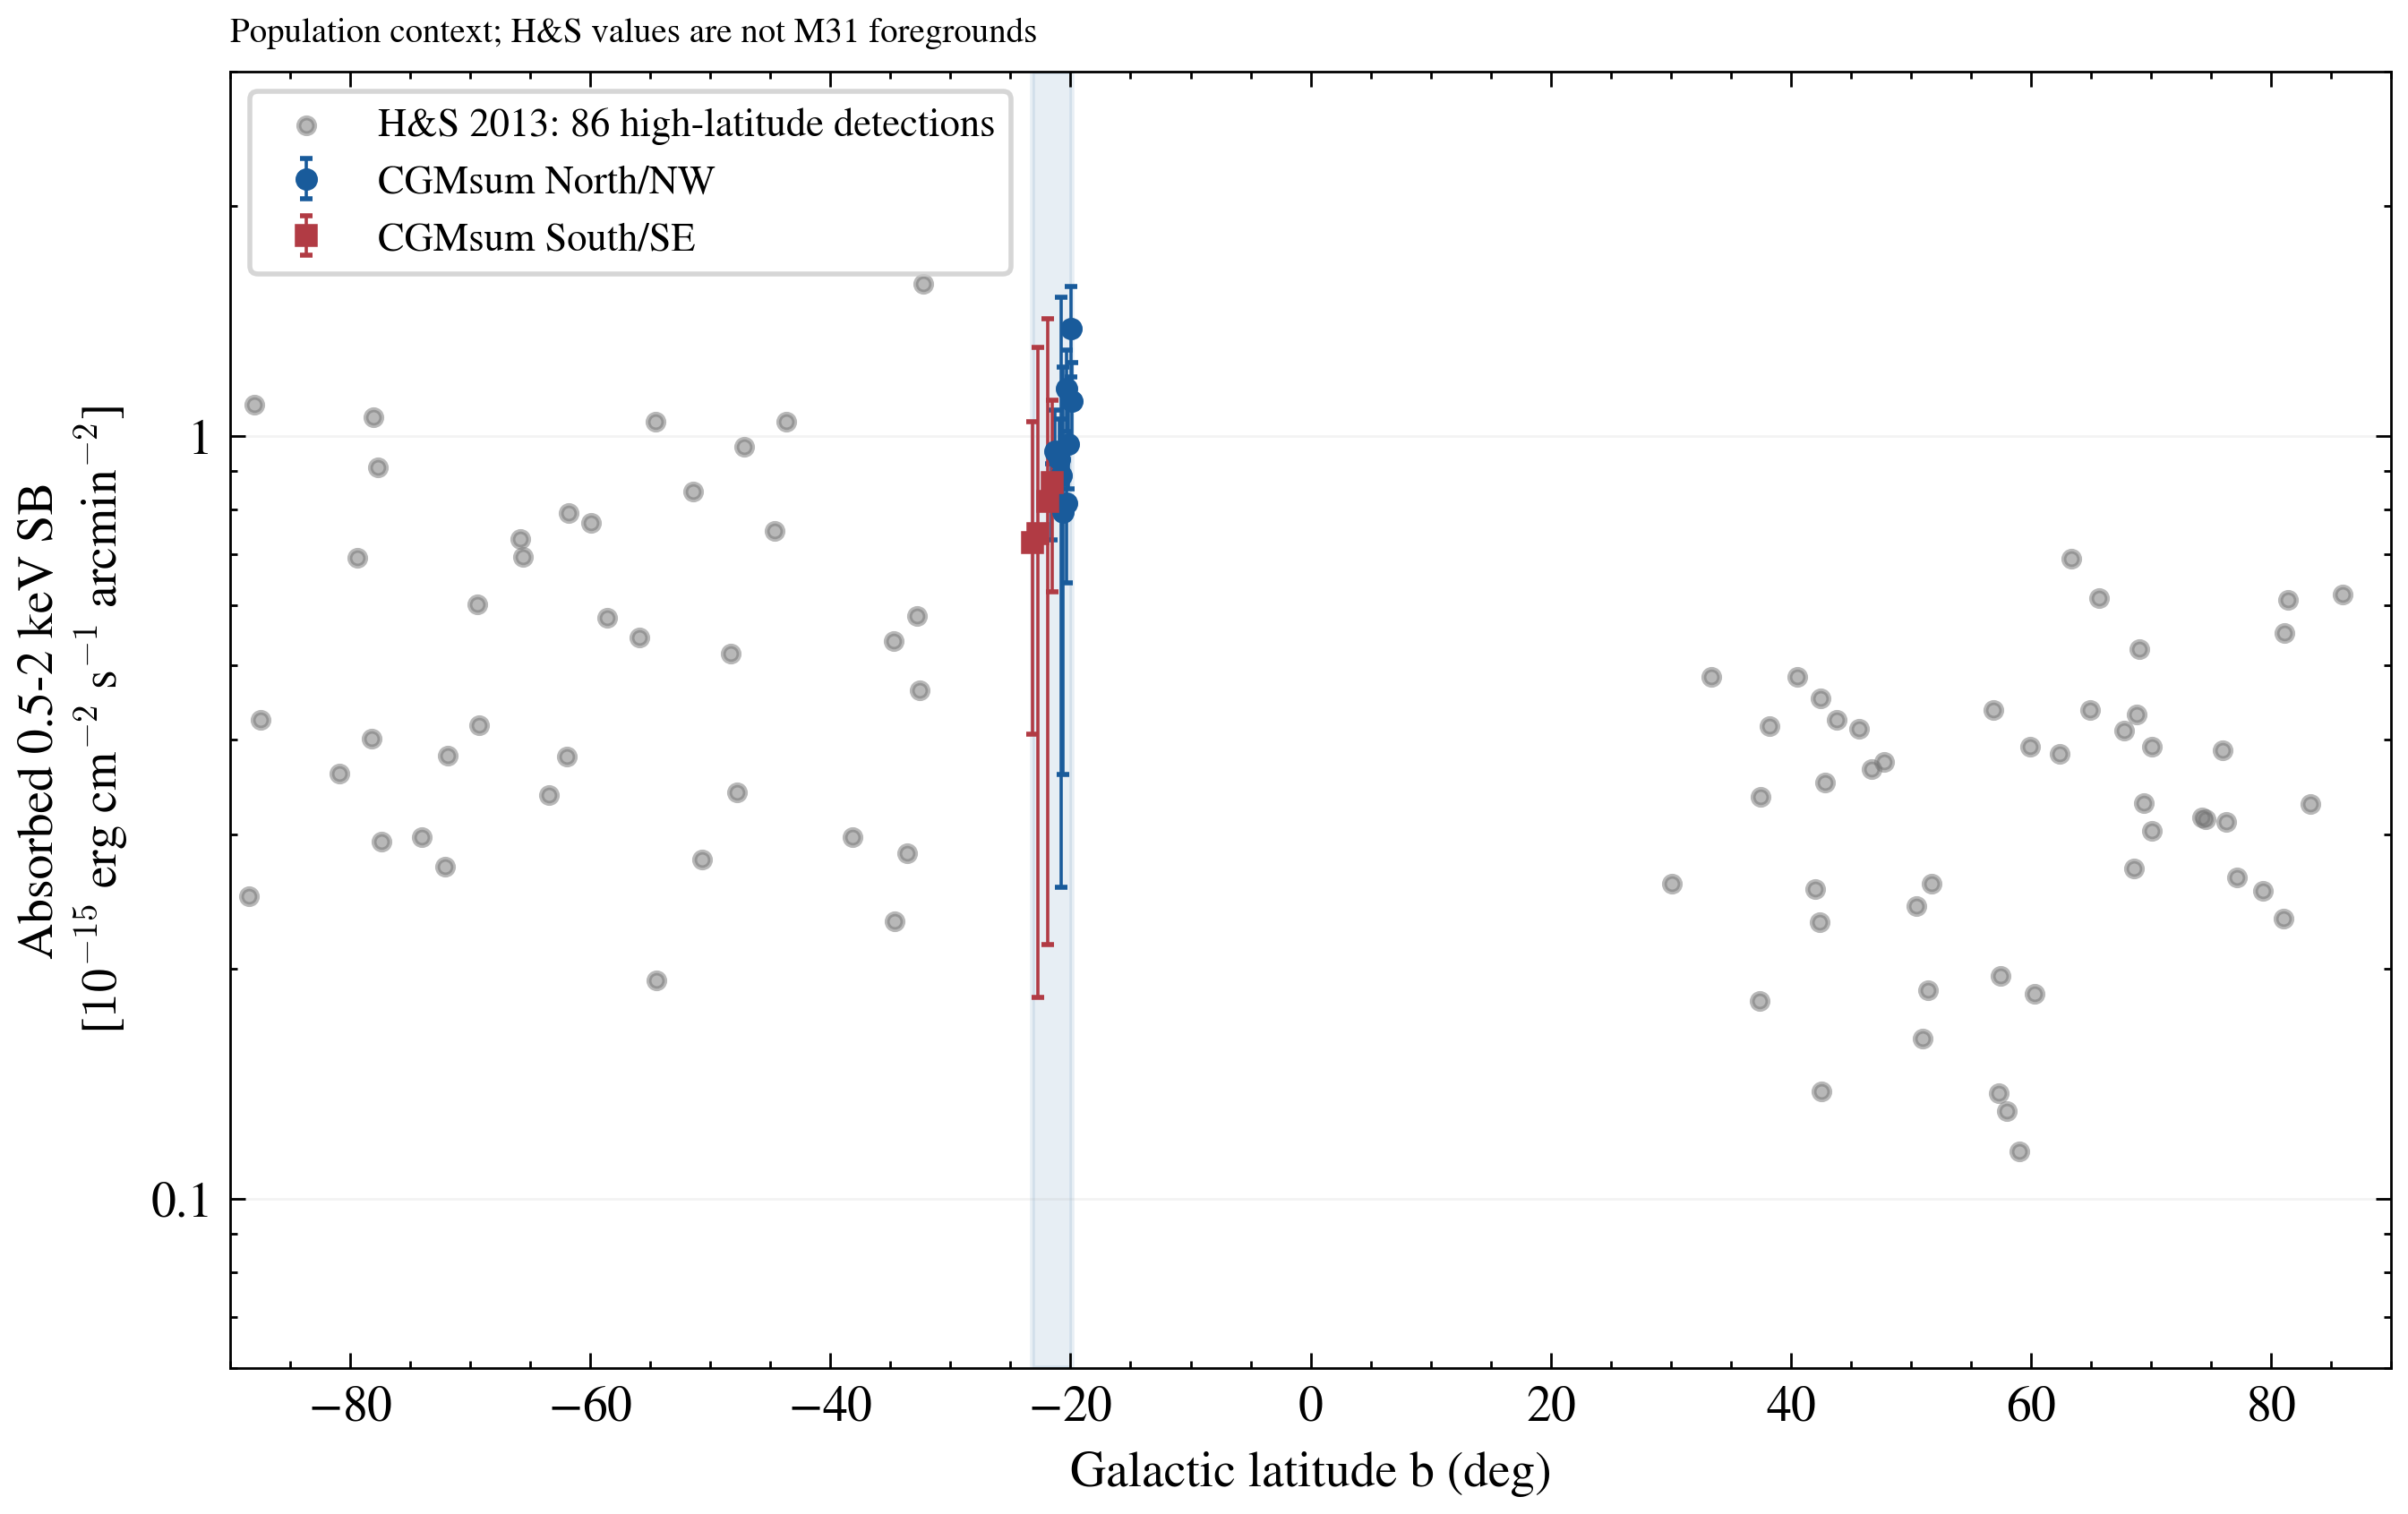
The 86 convertible high-latitude Henley & Shelton 2013 detections (grey) and our MW+M31 total component (blue/red) at their actual Galactic latitudes. Grey points have not been relocated toward M31; their scatter is neither our measurement error nor a local MW prior. The blue vertical strip marks our latitude coverage.

| Data or model | Native coordinates / observable | Comparison with our brightness |
|---|---|---|
| MW disk / flattened model | Three-dimensional R,z; sky l,b | Integrate along each actual (l,b), then display against b while retaining l and NH. |
| MW spherical halo model | Three-dimensional r; sightline emission | Project from the Sun to S(l,b); psi is a useful sky axis. Do not assign an observed brightness a unique r. |
| Locatelli 2024 | O VIII sky map; disk + halo | Retain the O VIII normalization bridge to the broad band; M31 lies outside the fitted longitude domain. |
| Ueda 2022 / HaloSat 2020 | Directional EM; n(R,z) or disk+halo | Retain audited predictions for the 14 sightlines; HaloSat is outside its original southern high-latitude domain. |
| Henley & Shelton 2013 | High-latitude sightline thermal brightness | Display population points at actual b or psi; not a radial foreground profile toward M31. |
| eFEDS / MW absorption studies | Sky-patch spectrum / integral n f_ion ds | Retain sky region and observable; density, absorption columns and emission brightness require model conversion. |
06 · Interpretation
Nearby stacks better resolve inner shape; amplitude remains conditional
The He & Li galaxies lie at 15–50 Mpc; Yi quoted about 400 Mpc for the median distance of her stack. A 30-arcsec angular scale corresponds approximately to 2–7 versus 58 kpc. He & Li more directly resolve the 10–30 kpc shape. The intrinsic Zhang inner profile still depends on the beta model and compact-source treatment.
The common ordinate uses Sabs = SigmaX × [pi/(180×60)]^2 / [4pi × (1 kpc in cm)^2] × 0.678988916. This absorption ratio is from the saved project APEC template: kT=0.175306 keV, Z=0.3 solar, NH=5.6×10^20 cm−2, angr abundances, and vern cross-sections.
This is a common-spectrum display conversion. It does not refit the literature count spectra, including the temperature distribution adopted by He & Li. The measured total cannot uniquely be allocated to two similarly cool components. A template above some total measurements indicates conditional tension to investigate; it does not imply negative MW emission or a separated M31 detection.
A formal MW/M31 constraint requires integration over the actual masks, field-specific absorption and responses, a spatial MW model, and mass/spectral systematics. This page is a reviewable comparison, with no new component detection or exclusion significance.
Zhang 2024 I: historical v1 · Zhang 2024 I: final v3 · Zhang 2024 II: integrated luminosity–mass scaling · He & Li 2026 v2 · He & Li public sample
Data and files