MW 纬度切片
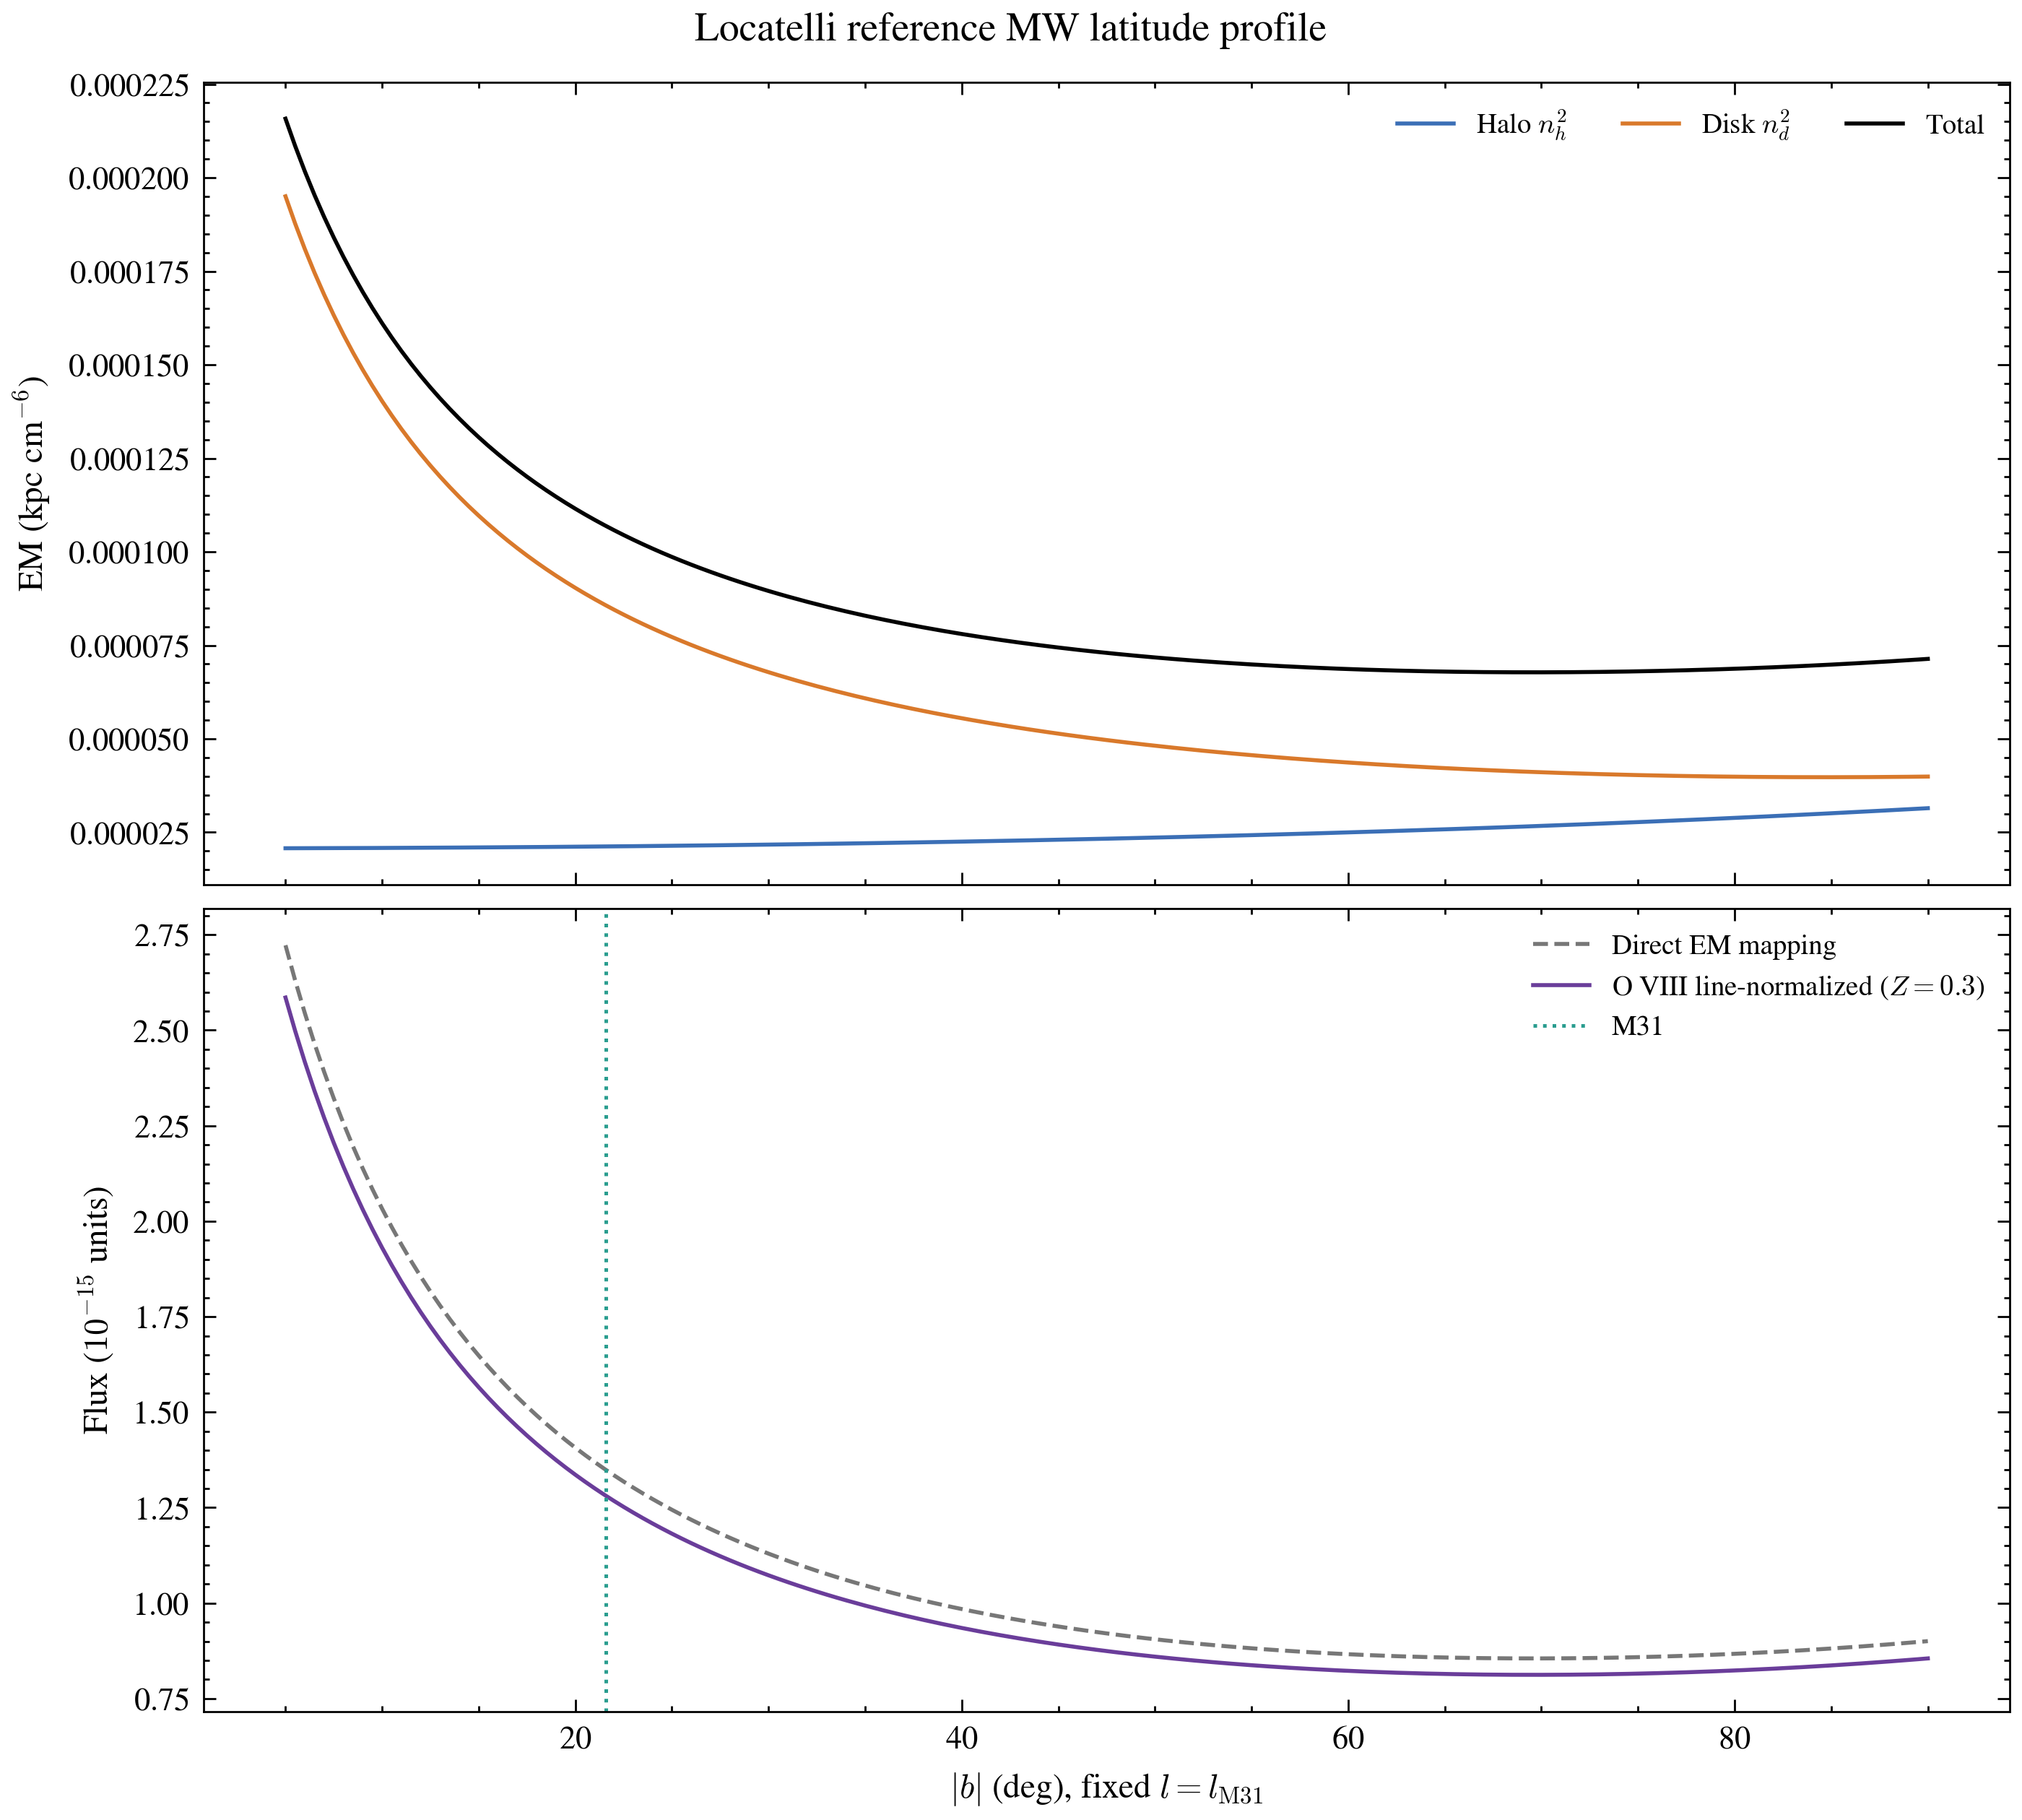
MW latitude slice
固定 Galactic longitude,改变南半球 b=−|b|。这是 internal-observer sky slice,不是 MW 三维半径。
Hold Galactic longitude fixed and vary southern b=−|b|. This is an internal-observer sky slice, not a 3D MW radius.
M31 CGMsum · model-to-observable audit
从 Milky Way 三维密度、视线积分和 O VIII emissivity,走到每个 XMM pointing 的 absorbed 0.5–2.0 keV surface brightness;再把它和 M31 周围10–30 kpc的观测视线总和放在同一套可审计坐标中。
Follow the Milky-Way density geometry through line-of-sight integration and O VIII emissivity to the absorbed 0.5–2.0 keV prediction for every XMM pointing, then place it beside the observed line-of-sight sum at 10–30 kpc around M31.
01 · measurement before decomposition
14个 primary fields 给出的是约0.18 keV phenomenological thermal component 的 absorbed surface brightness。当前 fit 中该分量没有独立的 MW/M31 distance tag。
The 14 primary fields measure the absorbed surface brightness of an approximately 0.18 keV phenomenological thermal component. The fit does not attach an independent MW/M31 distance tag.
quality-selected dual-MOS primary sample;不是全部22个 pointings。
Quality-selected dual-MOS primary sample, not all 22 pointings.
Figure 3及本站所有一致性检验统一使用absorbed标准比较band。
Figure 3 and all consistency tests on this page use the absorbed standard comparison band.
是数据产品名,不是纯 MW,也不是直接测得的 M31 contribution。
A data-product name: neither pure MW nor a directly measured M31 contribution.
0.5–2.0 keV是常见的跨样本文献比较band,因此D42将Figure 3及相连的一致性检验统一到这一convention。它不是v19的直接component-sensitive primary band:其中1.4–2.0 keV跨越了被排除的MOS仪器谱线区间,因此这部分依赖模型外推。直接基线仍是0.4–1.25 keV;对kT=0.175–0.20 keV、Z=0.1–0.3、NH=(4–8)×1020 cm−2的APEC grid,该band保留0.4–2.0 absorbed model flux的98.8–99.5%。
0.5–2.0 keV is the common cross-sample literature band, so D42 uses that convention for Figure 3 and its linked consistency diagnostics. It is not the direct component-sensitive primary band of v19: the 1.4–2.0 keV part crosses the excluded MOS instrumental-line interval and therefore depends on model extrapolation. The direct baseline remains 0.4–1.25 keV, which retains 98.8–99.5% of the absorbed 0.4–2.0 model flux across the audited kT=0.175–0.20 keV, Z=0.1–0.3, NH=(4–8)×1020 cm−2 APEC grid.
外部reference并不共享同一原始observable:Locatelli拟合0.614–0.694 keV O VIII窄带;Zhang使用rest-frame 0.5–2.0 keV;Grayson的emissivity图和比较语境支持intended 0.5–2.0 keV,但profile方法段没有明写event cut。本站先在各自原始band重建,再显式转换到absorbed 0.5–2.0 convention。旧0.4–1.25值仍作为v19 component-sensitive provenance保留,但不再用于Figure 3的一致性比较。
The external references do not share one native observable: Locatelli fits the 0.614–0.694 keV O VIII narrow band; Zhang uses rest-frame 0.5–2.0 keV; and Grayson's emissivity figure and comparison context support an intended 0.5–2.0 keV band, although its profile-method paragraph does not state the event cut explicitly. This site reconstructs each native observable before explicitly converting it to an absorbed 0.5–2.0 convention. The old 0.4–1.25 values remain available as v19 component-sensitive provenance but are no longer used in Figure 3's consistency comparison.
02 · three different coordinates
把它们混在一起会把 MW latitude dependence、M31-centric radius 和不规则 XMM footprint 误当成同一种“径向变化”。
Mixing them would turn MW latitude dependence, M31-centric radius, and an irregular XMM footprint into one misleading “radial trend.”
固定 Galactic longitude,改变南半球 b=−|b|。这是 internal-observer sky slice,不是 MW 三维半径。
Hold Galactic longitude fixed and vary southern b=−|b|. This is an internal-observer sky slice, not a 3D MW radius.
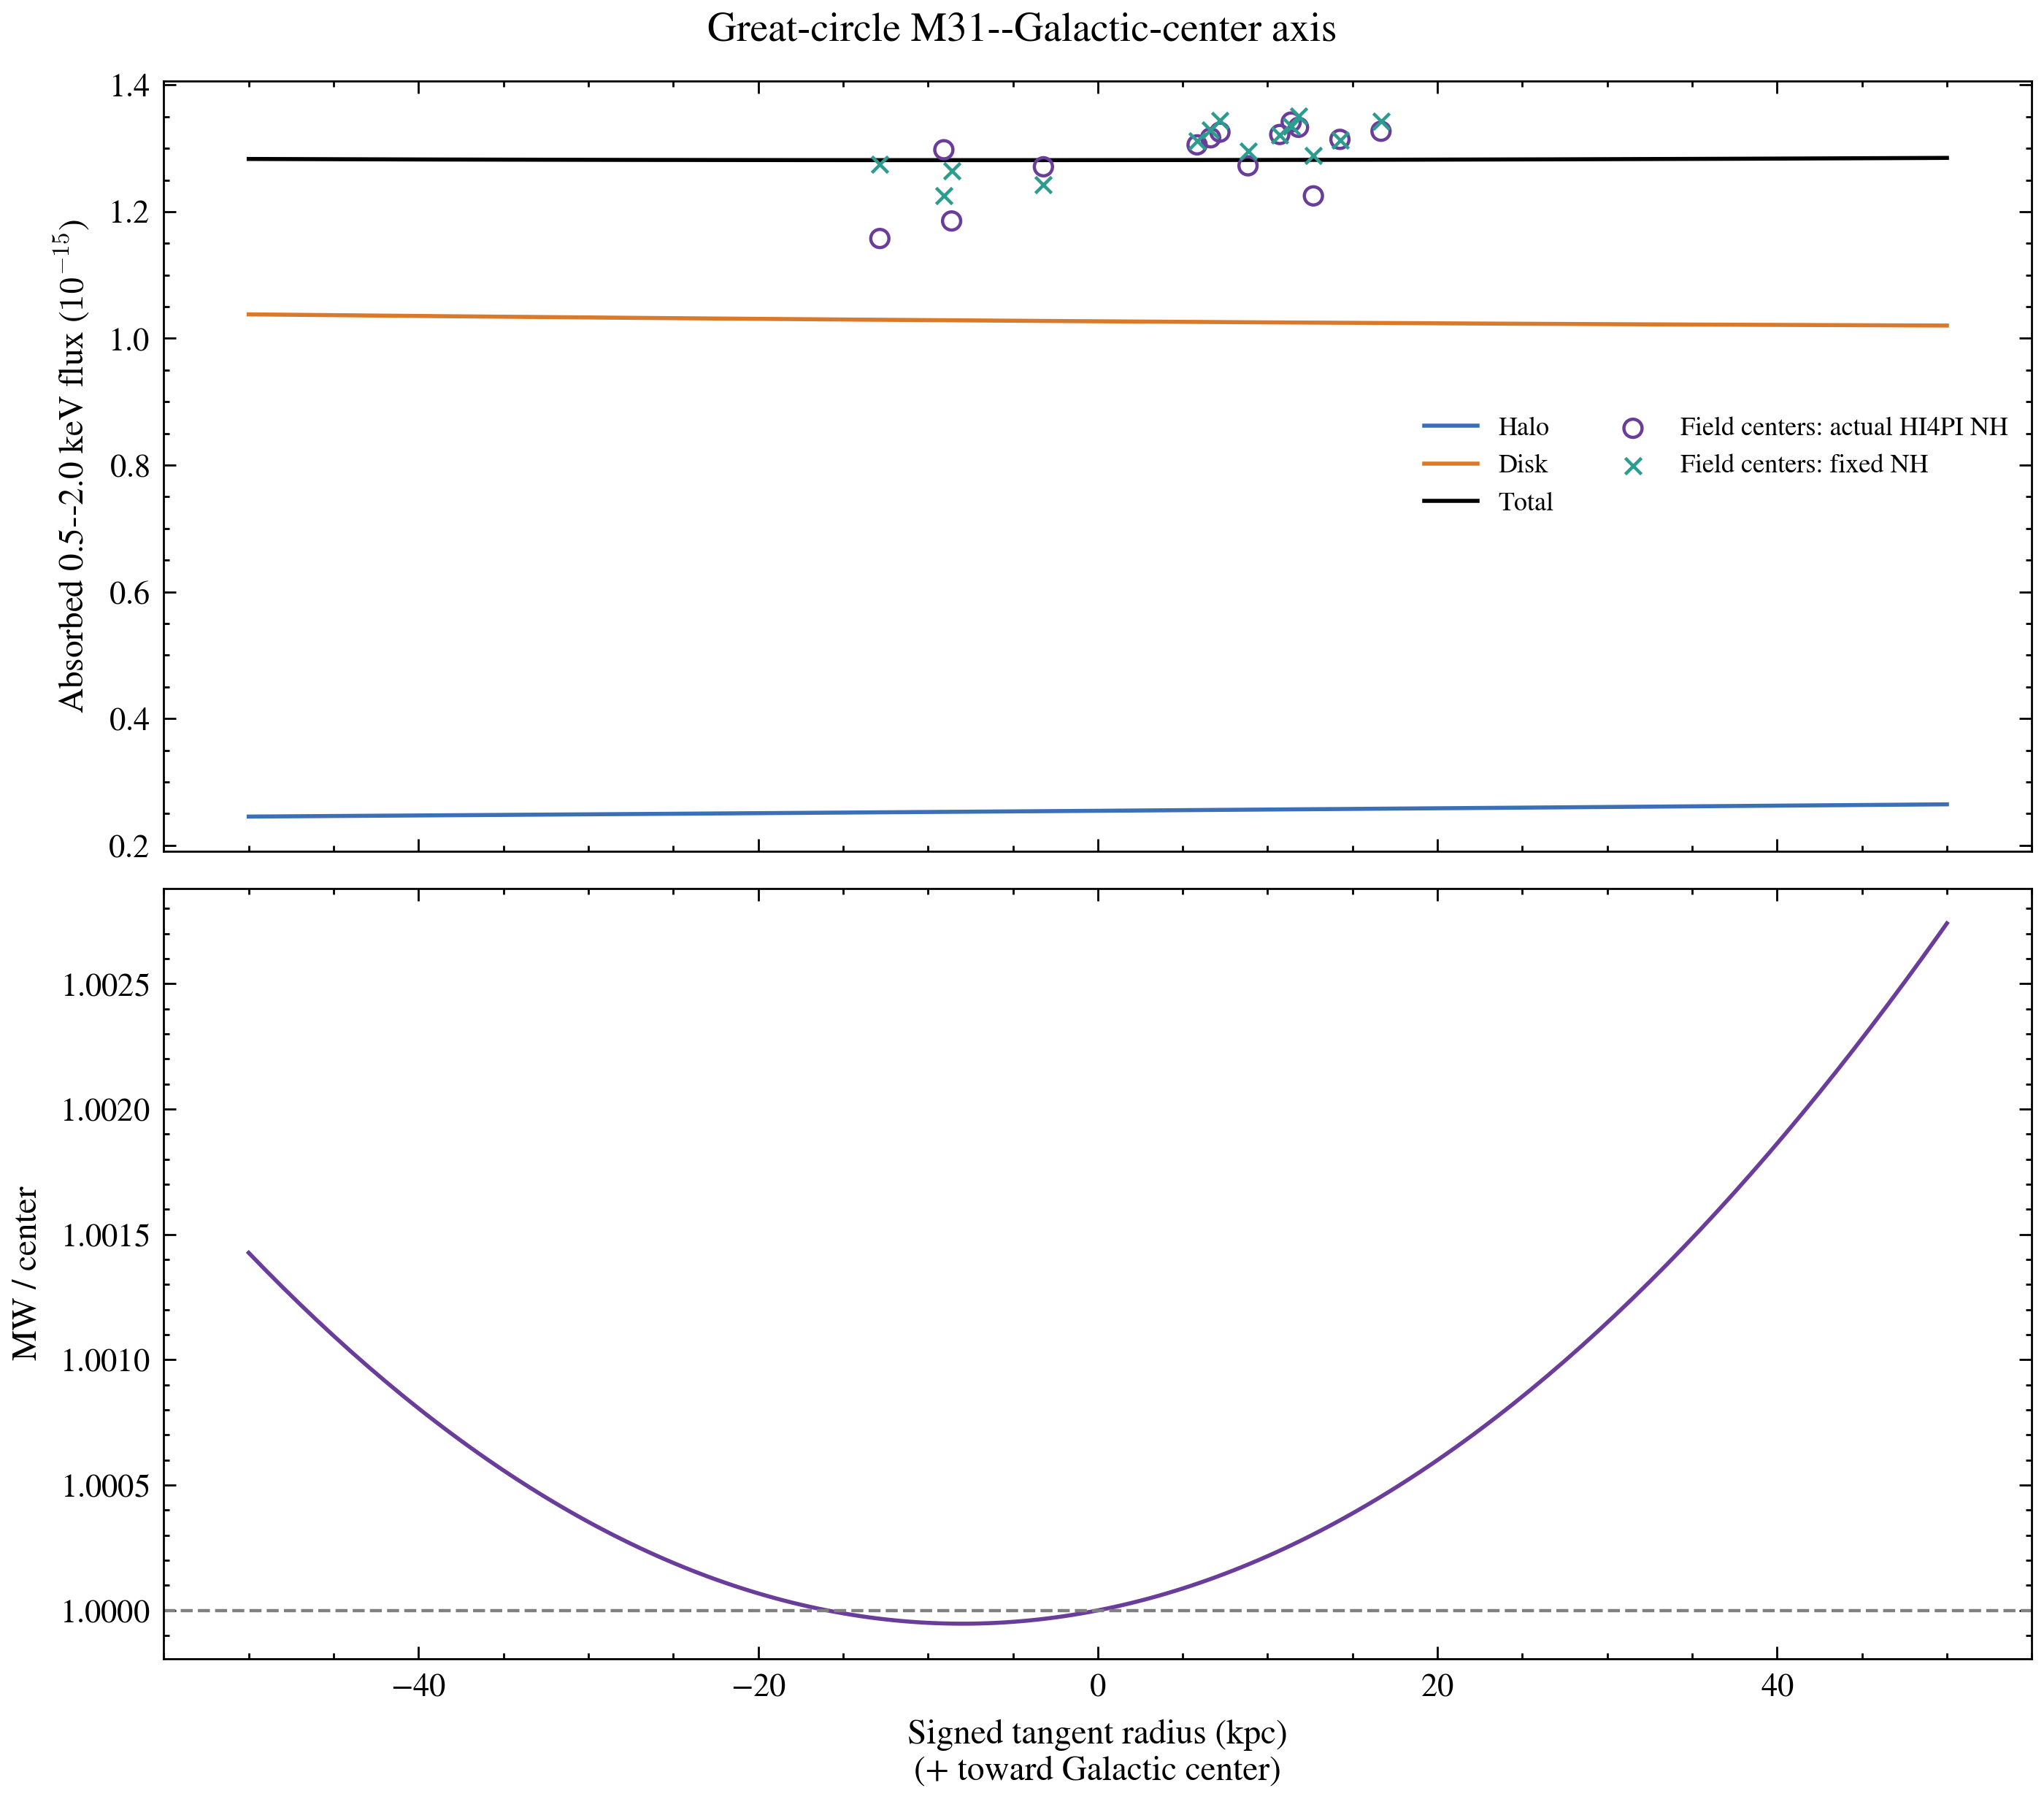
以 M31 为零点;正值指向 Galactic center,负值背离。R∥=DM31tanθ。
Zero at M31; positive toward the Galactic center, negative away. R∥=DM31tanθ.
用于放置14个观测 CGMsum points 和外部 M31-mass conditional templates;不携带 MW/M31 decomposition。
Places the 14 observed CGMsum points beside external M31-mass conditional templates; it carries no MW/M31 decomposition.
03 · model → observable
橙色 band 不是从论文表格抄来的 broadband prior。它是把一个 O VIII-constrained MW density geometry 投影到14个真实 sightlines,再固定O VIII line normalization、转换到Z=0.3 APEC的absorbed 0.5–2.0 keV broadband flux,并应用每场 HI4PI absorption 得到的。
The orange band is not a broadband prior copied from a table. It projects an O VIII-constrained MW density geometry through 14 real sightlines, holds the O VIII line normalization fixed, converts to the absorbed 0.5–2.0 keV broadband flux of a Z=0.3 APEC model, and applies field-specific HI4PI absorption.
使用 Locatelli et al. reference Combined β=0.5,而不是旧 combined+SWCX systematics branch。
Use the Locatelli et al. reference Combined β=0.5 model, not the old combined+SWCX systematics branch.
| β | C | n0 | Rh | zh | kT | Z |
|---|---|---|---|---|---|---|
| 0.5 | 0.046 | 0.032 cm−3 | 6.2 kpc | 1.1 kpc | 0.15 keV | 0.1 Z⊙ |
取 R0=8.2 kpc,s=0.001–350 kpc。实现积分的是 nh²+nd²;没有使用 (nh+nd)²,因此没有人为加入2nhnd cross term。
Use R0=8.2 kpc and s=0.001–350 kpc. The implementation integrates nh²+nd², not (nh+nd)², so it does not insert a 2nhnd cross term.
14个 reference sightlines 的 intrinsic O VIII intensity 约4.14–4.56 L.U.。这里还没有应用 photoelectric absorption,也还不是 broadband energy flux。
The 14 reference sightlines have intrinsic O VIII intensities of about 4.14–4.56 L.U. This is before photoelectric absorption and is not yet a broadband energy flux.
Figure 3把Locatelli的published O VIII line normalization固定,再用Z=0.3 target APEC转换到宽带。80 eV smoothing必须在窄带emissivity匹配前应用;跳过它会错误改变line-to-broadband normalization。这里没有使用真实 MOS RMF/ARF,因此不是 detector response-folded spectrum。
Figure 3 holds the published Locatelli O VIII line normalization fixed and converts it to a Z=0.3 target APEC broadband flux. The 80-eV smoothing is applied before matching narrow-band emissivities; omitting it would change the line-to-broadband normalization incorrectly. No real MOS RMF/ARF is used, so this is not a detector-response-folded spectrum.
其中1 sr=(180×60/π)² arcmin²,最后除以10⁻¹⁵得到网页和 Figure 3 的units。采用 Anders & Grevesse abundance、Verner cross-sections。连续 profile 曲线只使用明确标注的固定 NH;只有14个实测 footprint points 使用各自 HI4PI column。
Here 1 sr=(180×60/π)² arcmin², and division by 10⁻¹⁵ gives the units used on this page and in Figure 3. We use Anders & Grevesse abundances and Verner cross-sections. Continuous profile curves use an explicitly labeled fixed NH; only the 14 real footprint points use their individual HI4PI columns.
field min–max、North/South inverse-variance means、side-balanced central 和 all-field inverse-variance central 是四个不同 summaries,不能互换。
Field min–max, North/South inverse-variance means, the side-balanced central, and the all-field inverse-variance central are four different summaries and are not interchangeable.
04 · fixed-longitude latitude slice
固定 l=lM31=121.174329°,沿南半球 b=−|b| 改变视线。这里用固定 NH=0.056×1022 cm−2,目的是单独观察 density geometry,不是假装拥有连续 HI4PI map。
Hold l=lM31=121.174329° and vary the southern sightline b=−|b|. The fixed NH=0.056×1022 cm−2 isolates density geometry; it does not pretend to use a continuous HI4PI map.
| |b| (deg) | MW absorbed 0.5–2.0 keV |
|---|---|
| 10.0000 | 1.930 |
| 20.0000 | 1.336 |
| 21.5000 (nearest M31 grid point) | 1.284 |
| 30.0000 | 1.073 |
| 45.0000 | 0.892 |
| 60.0000 | 0.823 |
| 90.0000 | 0.855 |
单位均为10⁻¹⁵ erg cm⁻² s⁻¹ arcmin⁻²,固定 NH=0.056×10²² cm⁻²。90°附近的轻微回升是该 named geometry 的性质,不是观测。
Units are 10⁻¹⁵ erg cm⁻² s⁻¹ arcmin⁻² at fixed NH=0.056×10²² cm⁻². The mild upturn near 90° is a property of the named geometry, not an observation.
density geometry 对 z 使用 |z|,但真实 Galactic absorption 和其他 foreground 并不保证南北对称。本页连续曲线固定在 M31 所在的 southern branch;若以后接入连续 HI4PI map,必须分别计算正负 b,而不能只靠 |b|。
The density geometry uses |z|, but real Galactic absorption and other foregrounds need not be north–south symmetric. The continuous curve stays on M31's southern branch. A future continuous HI4PI version must compute positive and negative b separately.
05 · signed sky-plane axis
这条轴不是 MW Galactocentric radius。它只是穿过 M31 的天球切线方向,用来检验在 M31 的10–30 kpc角尺度内,MW geometry 是否会制造明显梯度。
This is not a MW Galactocentric radius. It is the tangent-plane direction through M31 used to test whether MW geometry creates a substantial gradient across M31's 10–30 kpc angular scale.
06 · data versus conditional templates
横坐标现在改为 circular M31 projected radius。点是数据;曲线和横带是外部假设。它们可以比较,但不能在图例中混成同一种 measurement。
The horizontal coordinate is now circular M31 projected radius. Points are data; curves and horizontal bands are external assumptions. They can be compared, but not merged into one kind of measurement.
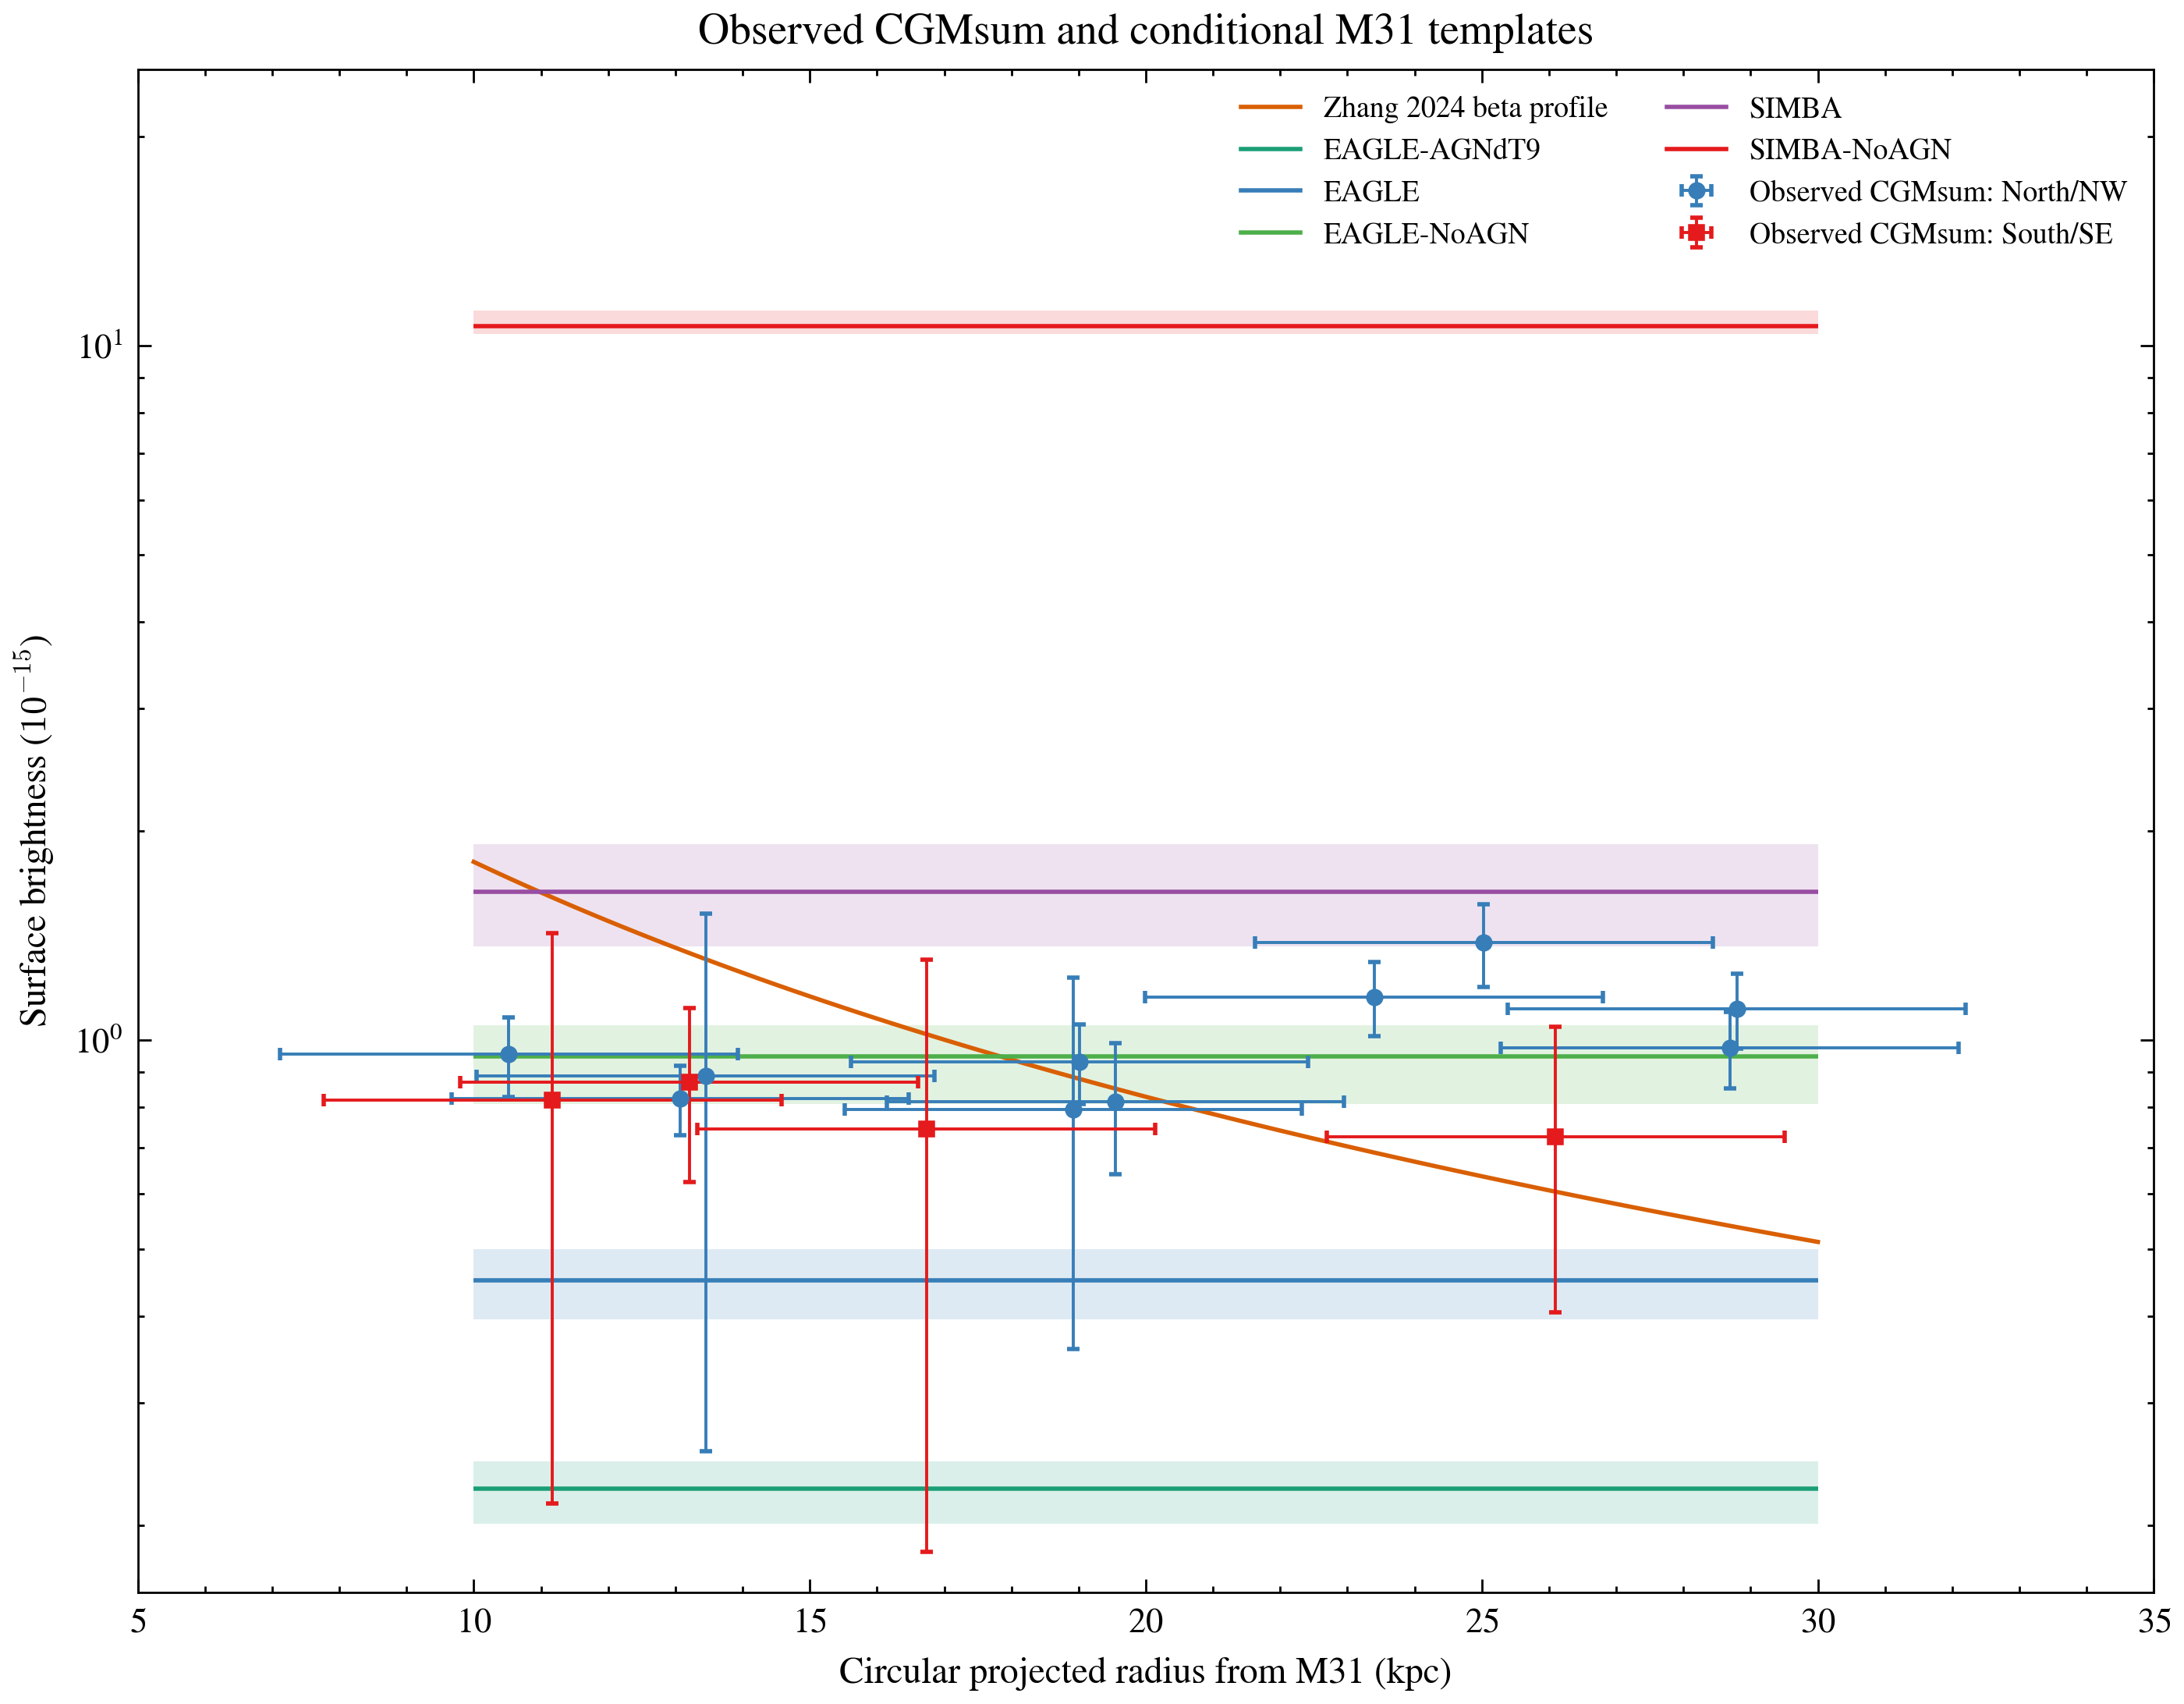
采用 rc=4 kpc、β=0.37,并令 absorbed 0.5–2.0 keV S(20 kpc)=0.8285。条件曲线在10/15/20/25/30 kpc约为1.805/1.156/0.828/0.636/0.512。它是 population template,不是本项目从14个 XMM spectra 单独恢复的 M31 profile。
Use rc=4 kpc and β=0.37 with absorbed 0.5–2.0 keV S(20 kpc)=0.8285. The conditional curve is approximately 1.805/1.156/0.828/0.636/0.512 at 10/15/20/25/30 kpc. It is a population template, not an M31 profile recovered independently from the 14 XMM spectra.
07 · MW-prior consistency test
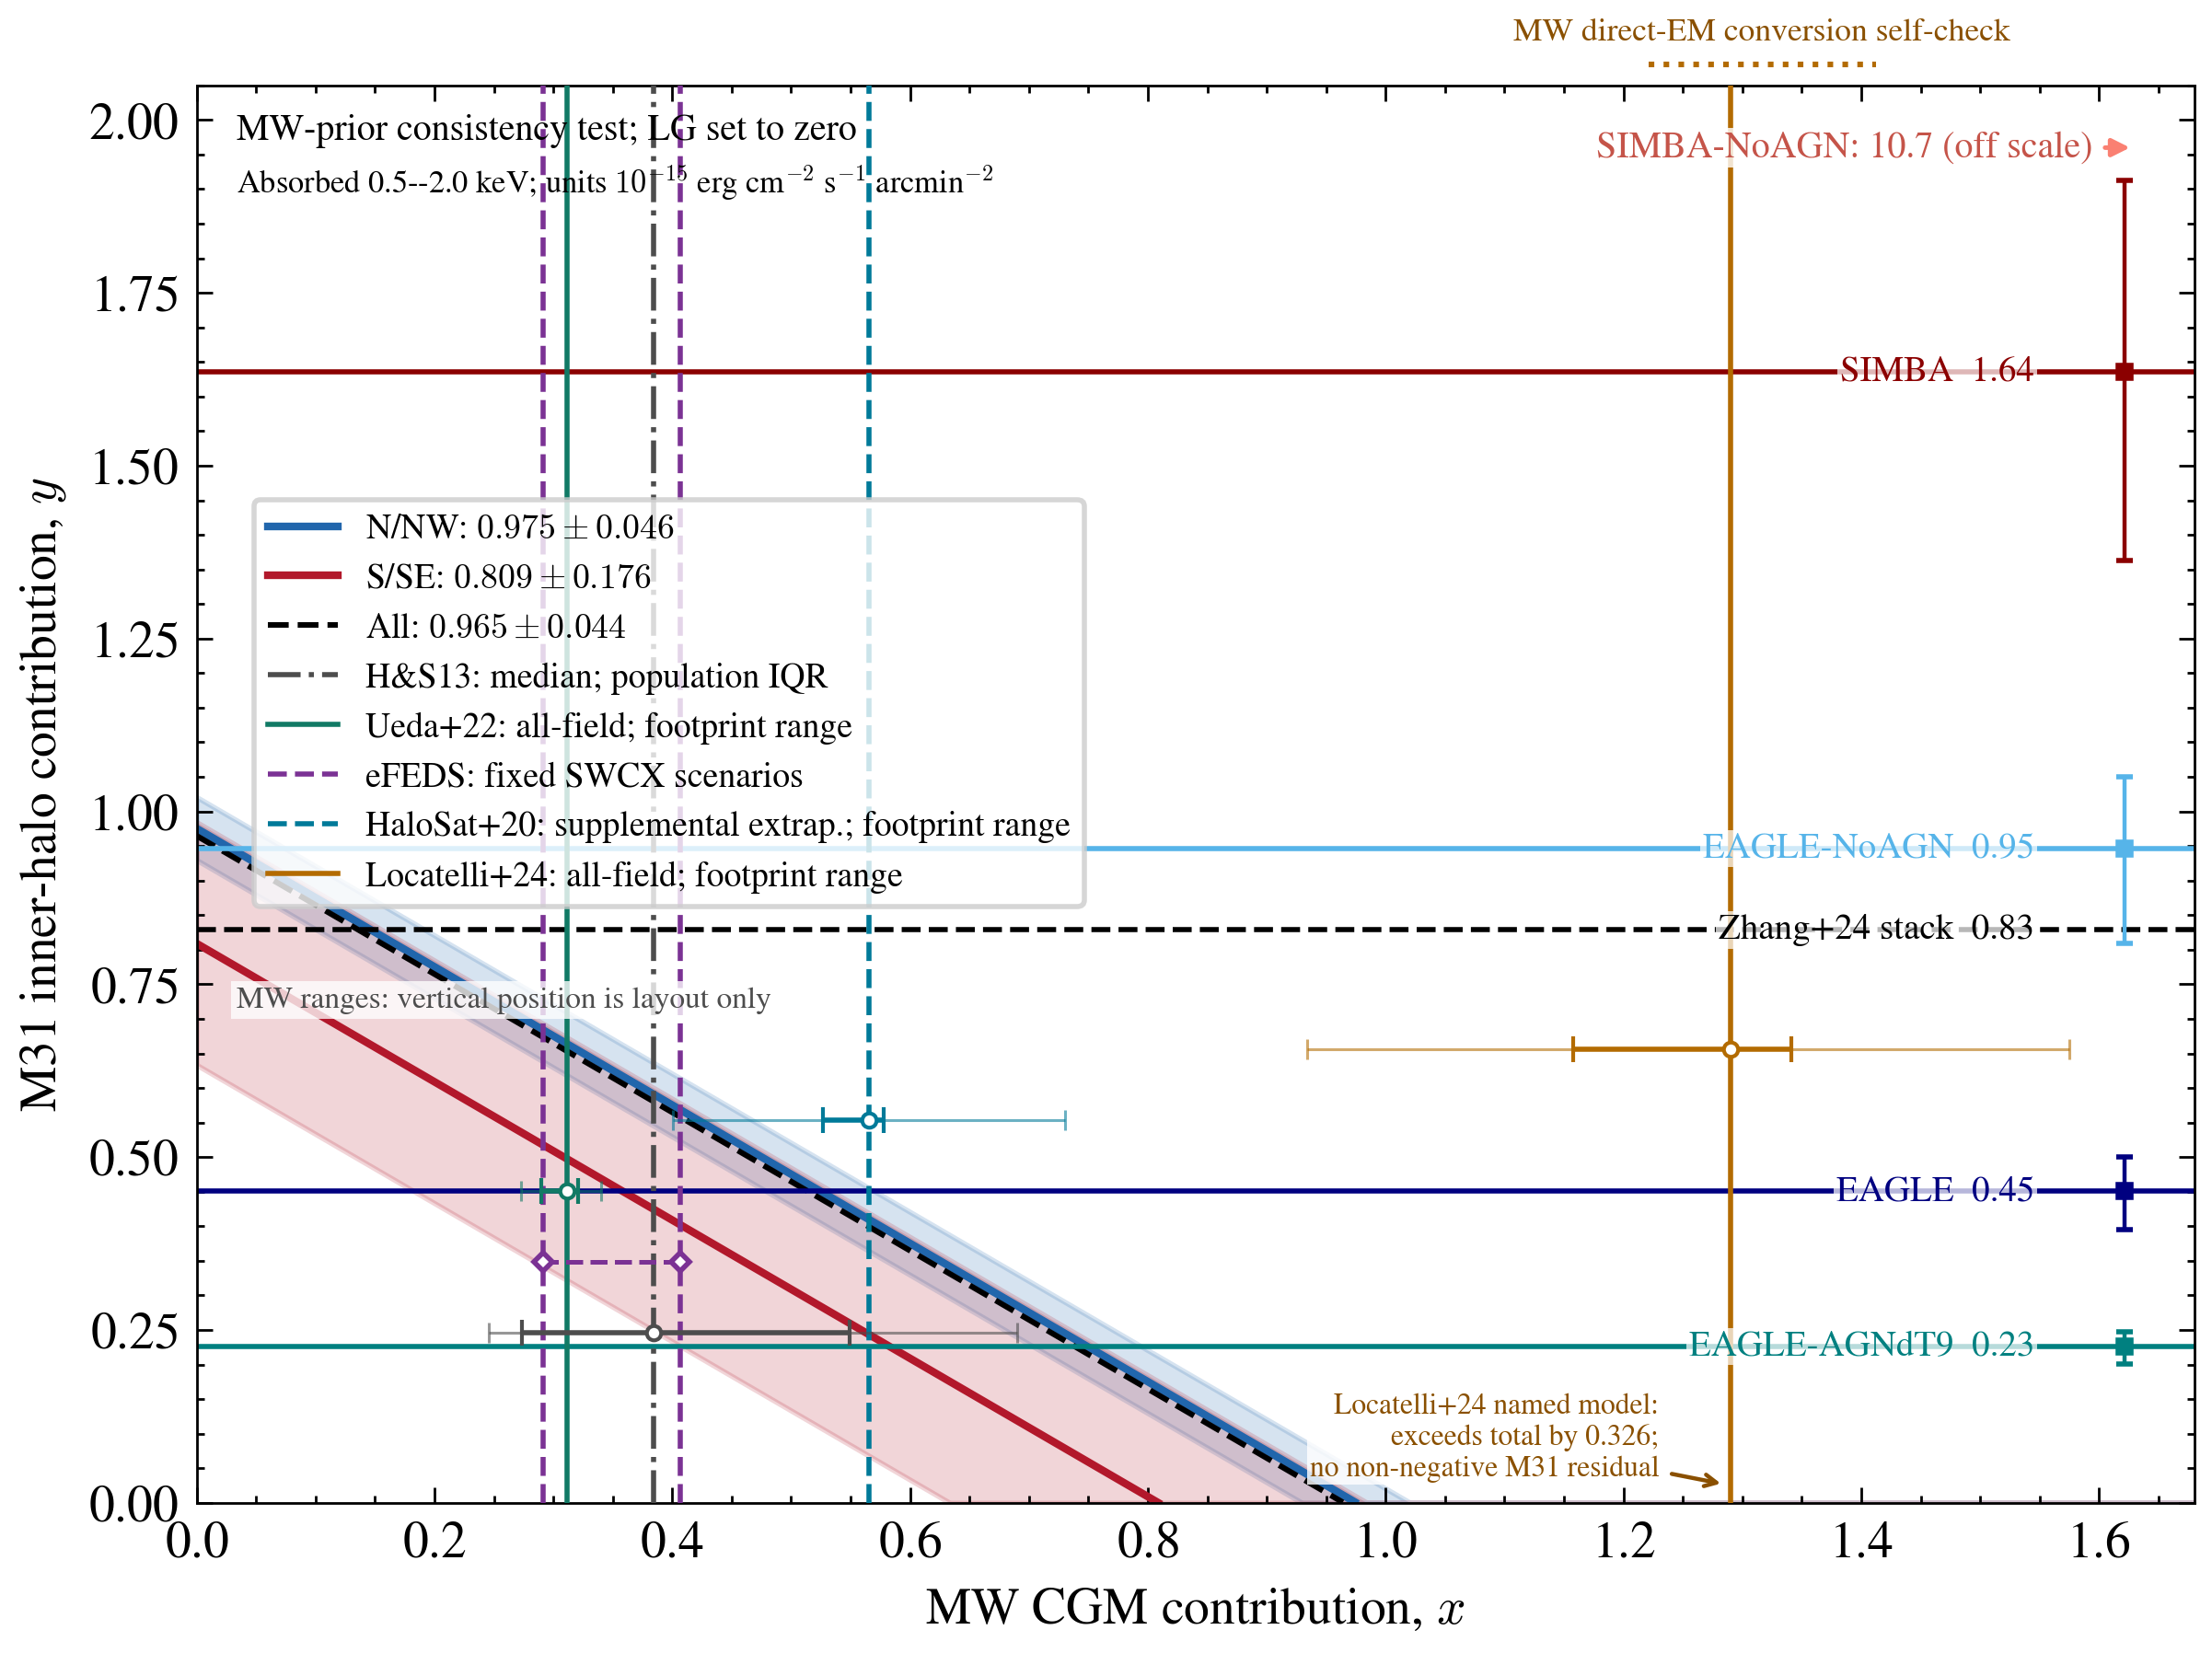
Figure 3 的横轴不是天空位置,而是假定的 MW contribution;纵轴是假定的 M31 contribution。数据本身只给出 x+y=total 的斜带。所有彩色竖向信息都是MW轴上的外部reference,不是“正确答案”。
Figure 3's horizontal axis is not a sky coordinate but an assumed MW contribution; the vertical axis is an assumed M31 contribution. The data provide only diagonal x+y=total bands. Every colored vertical feature is an external MW-axis reference, not a privileged answer.
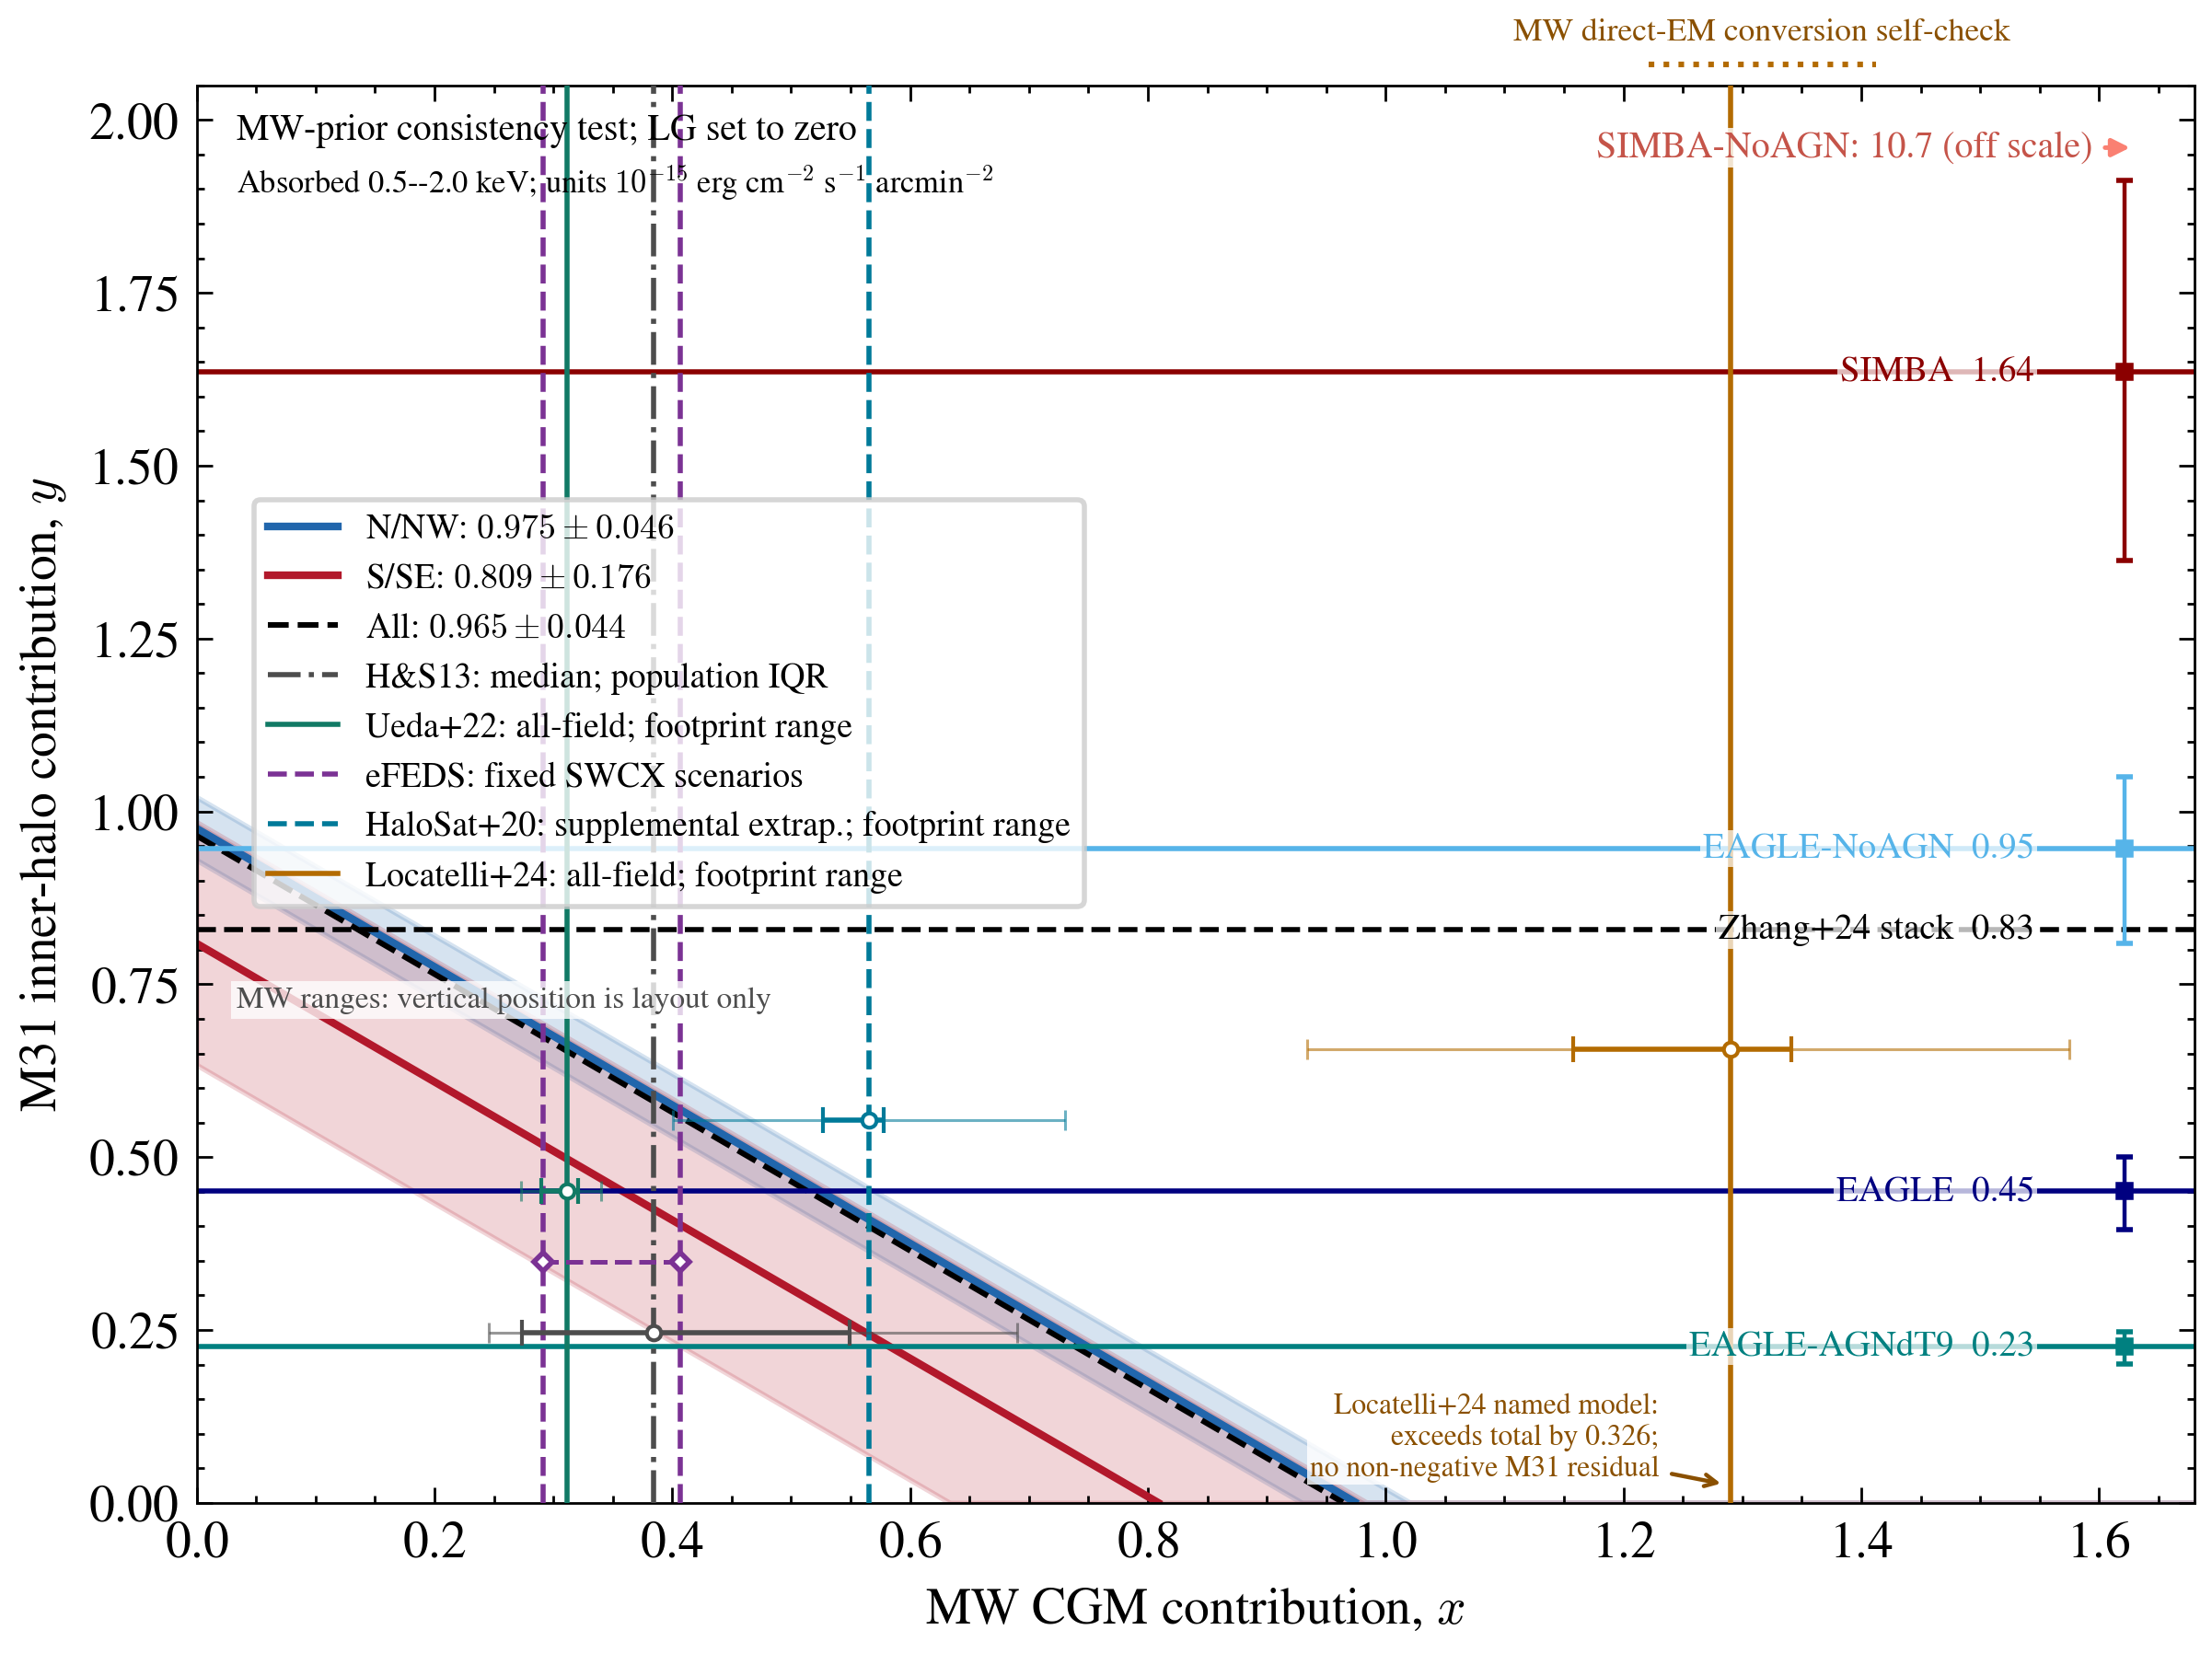
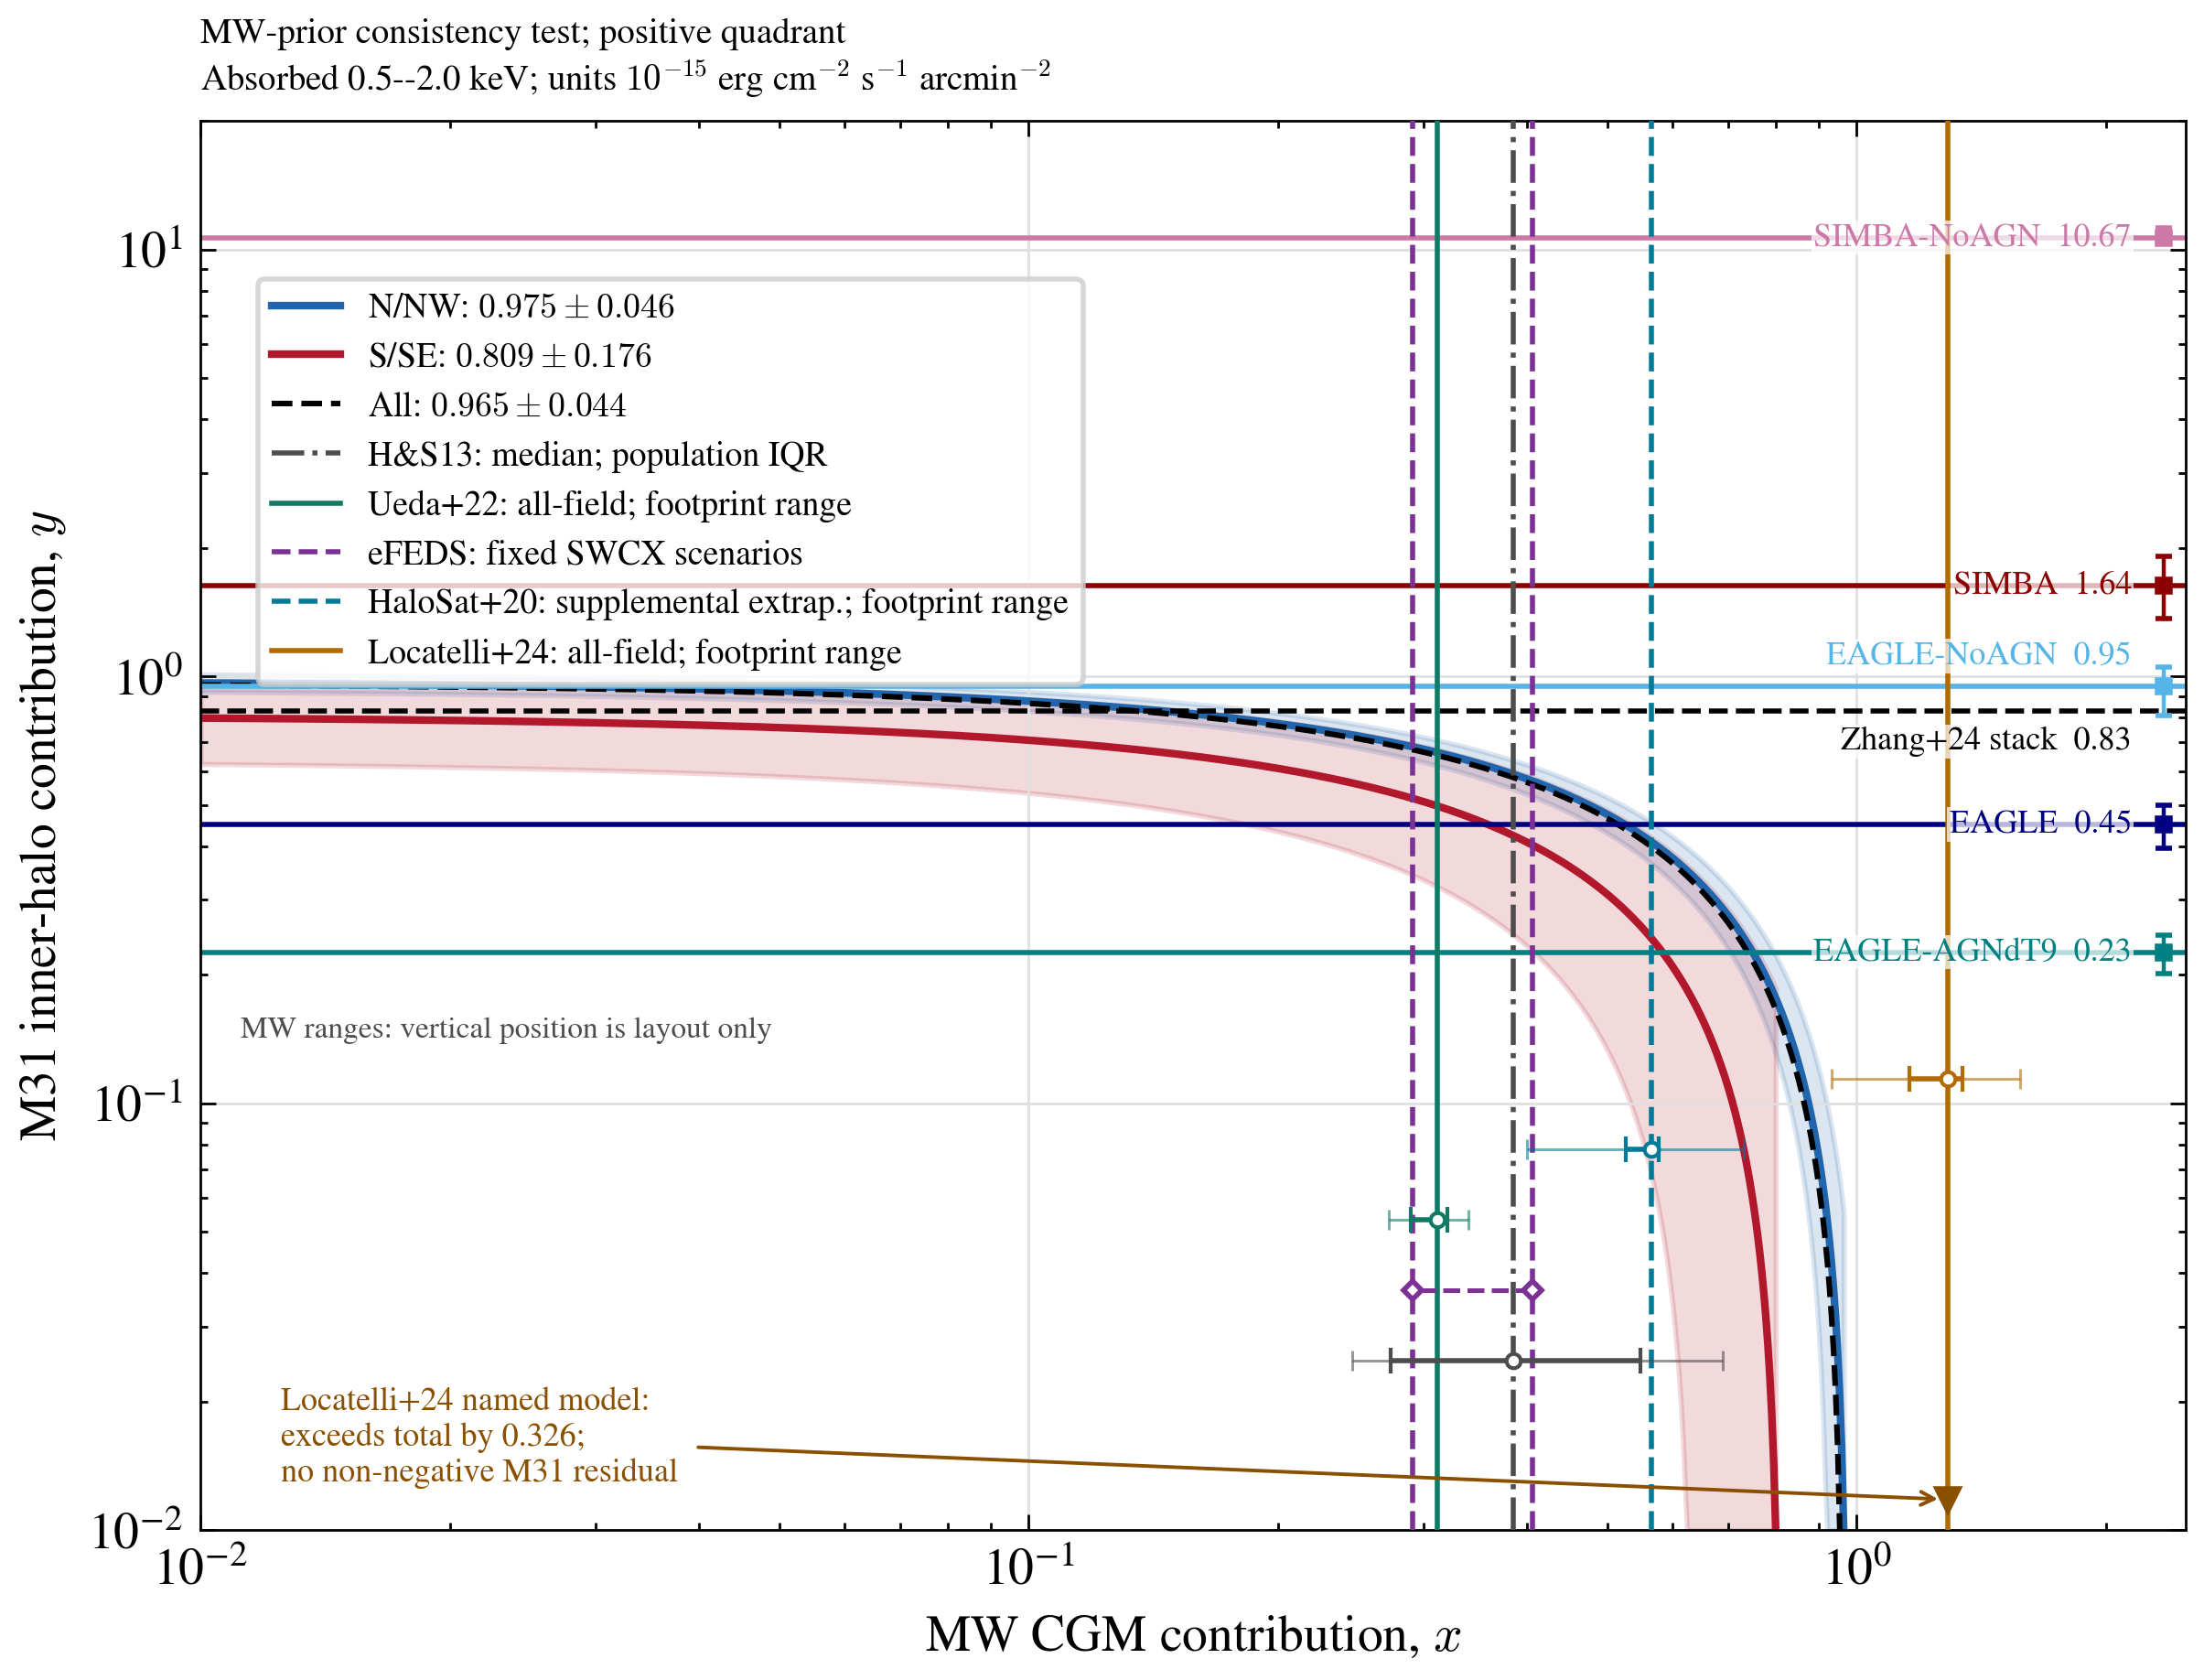
Figure 3 · source-to-point library
7个study pages解释原始观测或simulation;12个point pages逐步记录原文量、common-band或M31 transfer、额外假设与Figure 3结果。每个数字都反向绑定frozen ledger。
Seven study pages explain the native observations or simulations; twelve point pages trace the published quantity, common-band or M31 transfer, added assumptions, and final Figure 3 result. Every number is bound back to the frozen ledger.
high-latitude population context
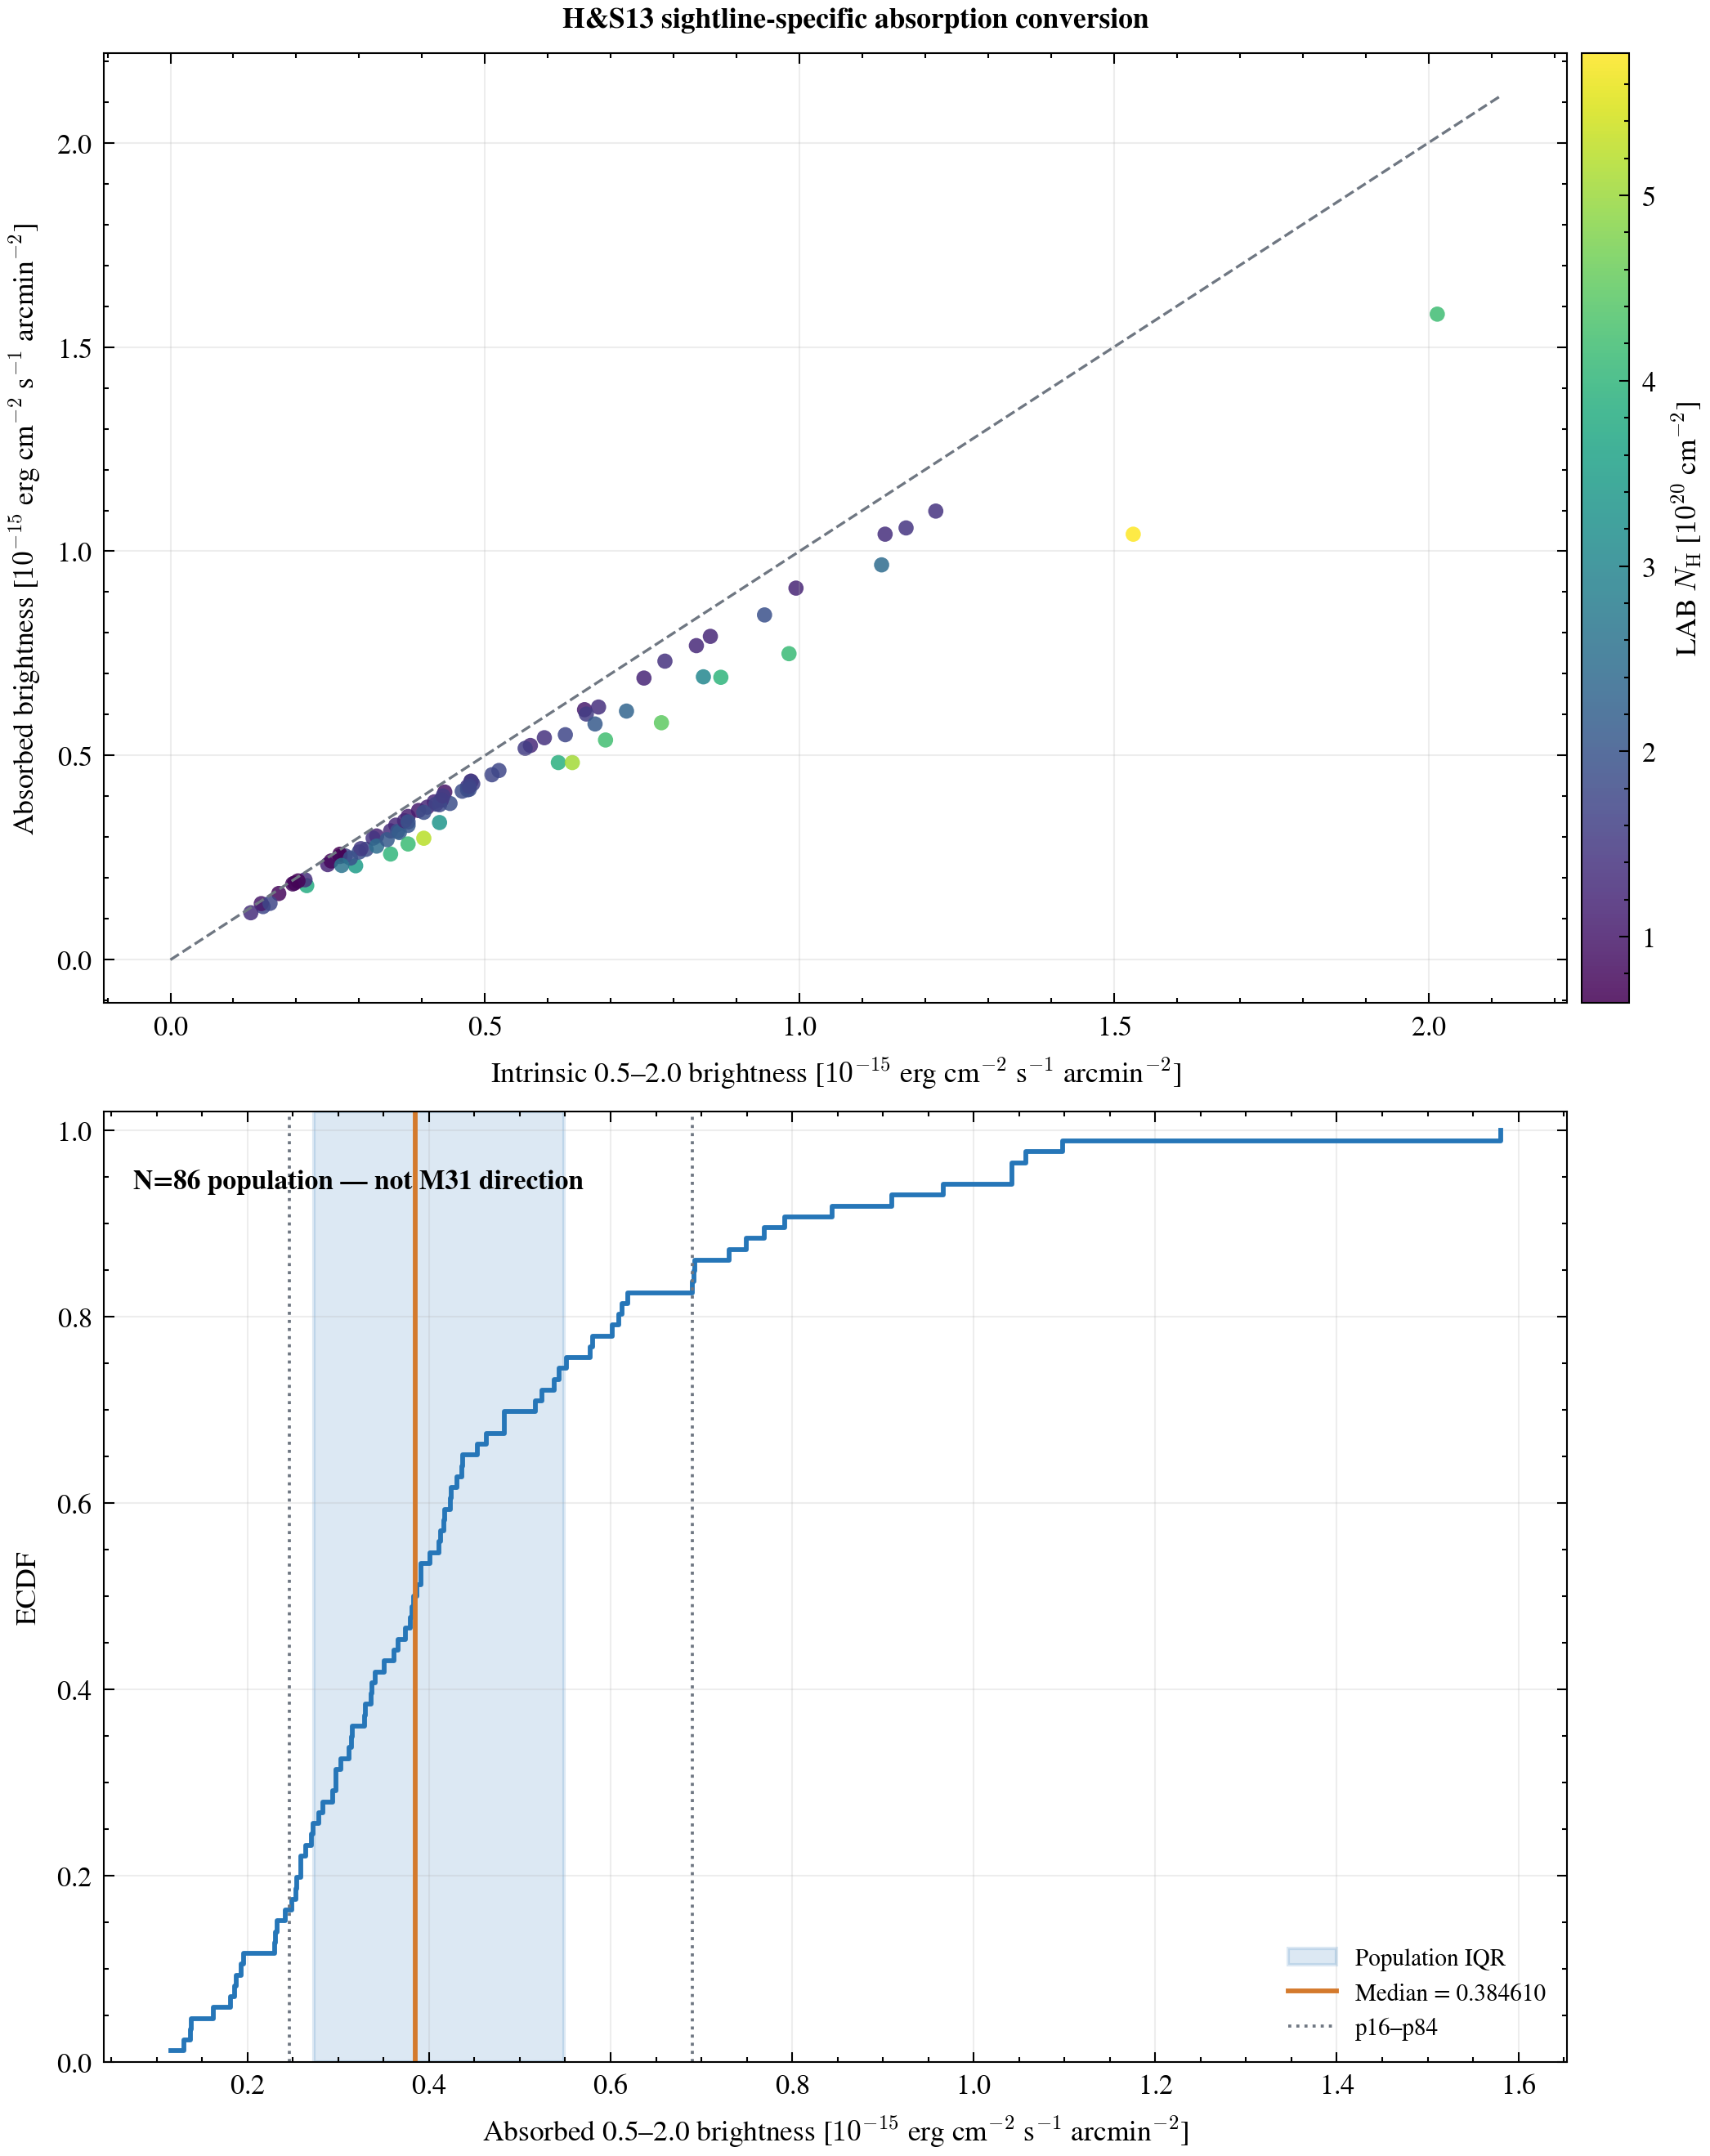
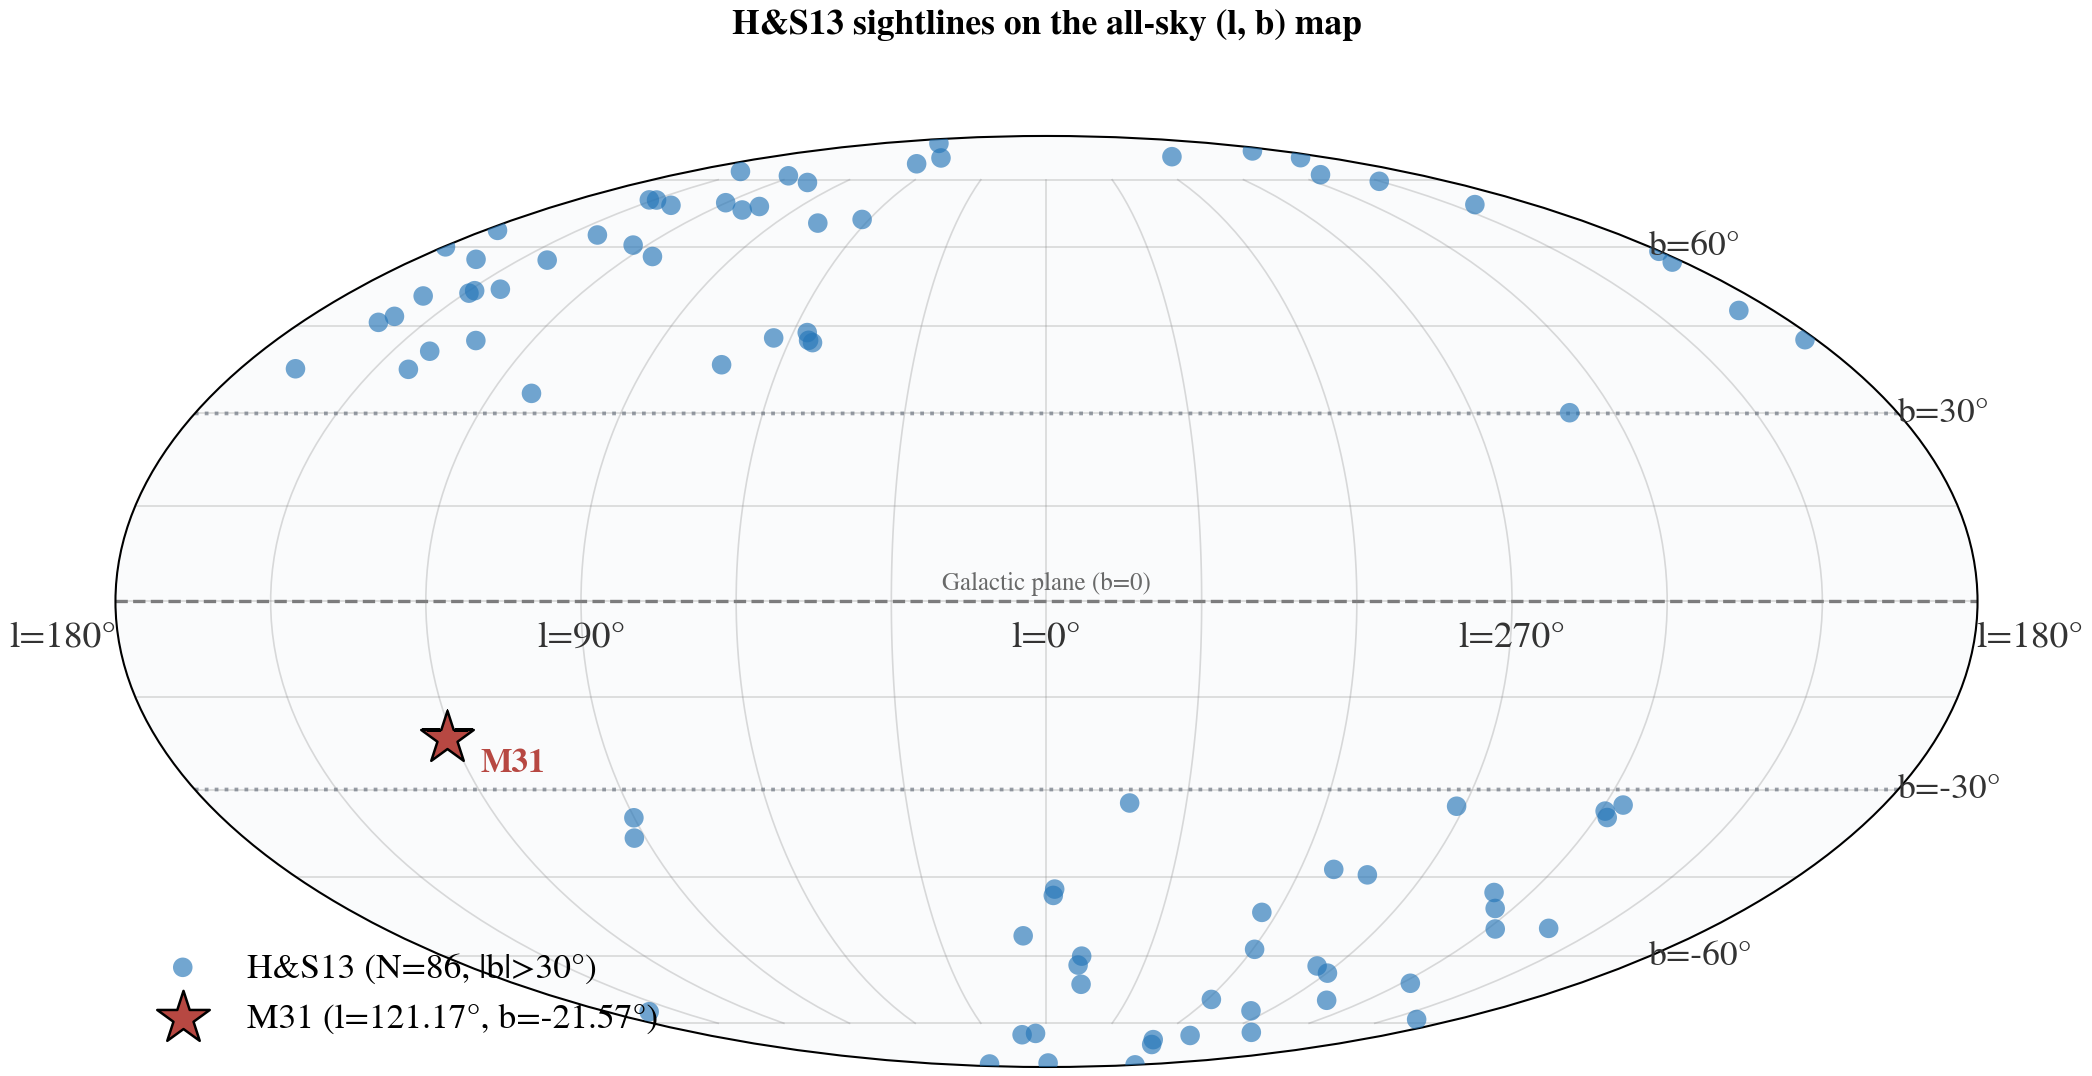
这是一项XMM-Newton高银纬软X射线背景视线样本研究。Figure 3使用它描述不同高纬视线上的Galactic-halo brightness population,而不是把其median当成M31方向的局部前景测量。
This is an XMM-Newton high-Galactic-latitude survey of soft-X-ray-background sightlines. Figure 3 uses it as a population distribution of Galactic-halo brightness, not as a local foreground measurement toward M31.
distant-sky fixed-scenario comparator
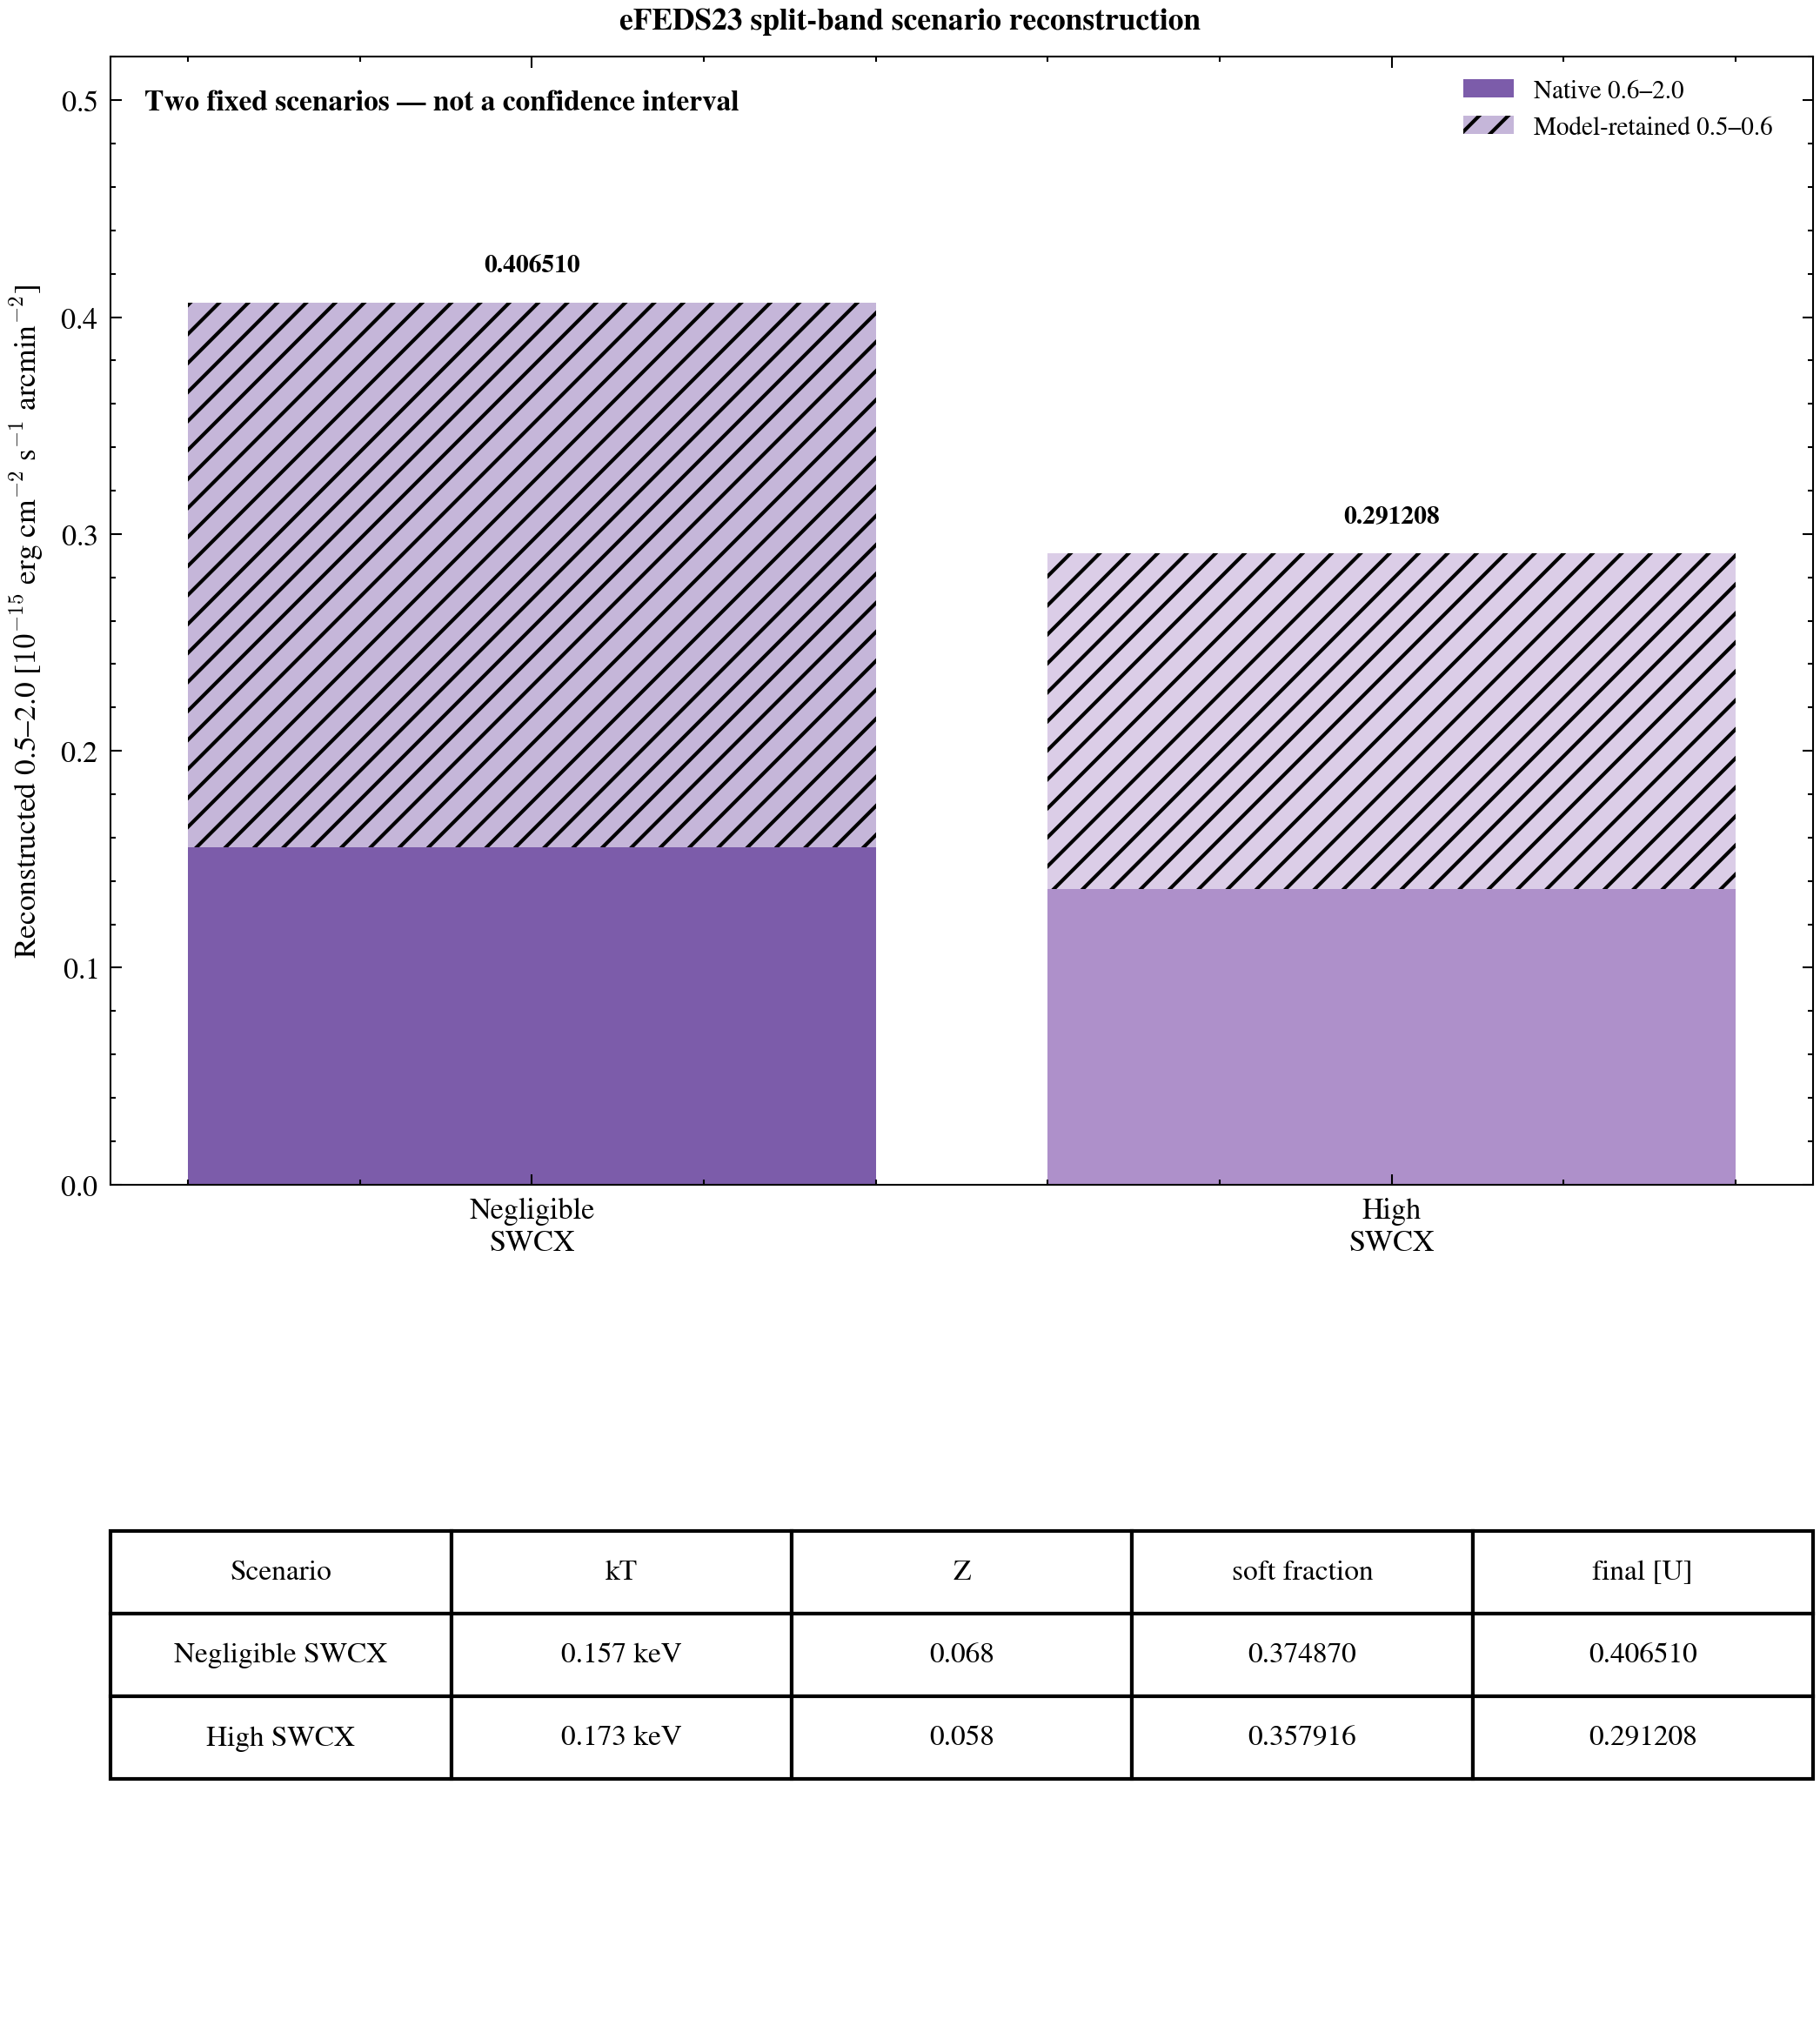
Ponti et al.利用eFEDS深场分解外层MW hot-CGM emission,并显式比较negligible与high-SWCX两种固定情景。Figure 3保留两个情景点,不构造central value。
Ponti et al. decompose outer Milky-Way hot-CGM emission in the eFEDS field and explicitly compare fixed negligible- and high-SWCX scenarios. Figure 3 retains both scenario points without inventing a central value.
in-domain directional footprint model
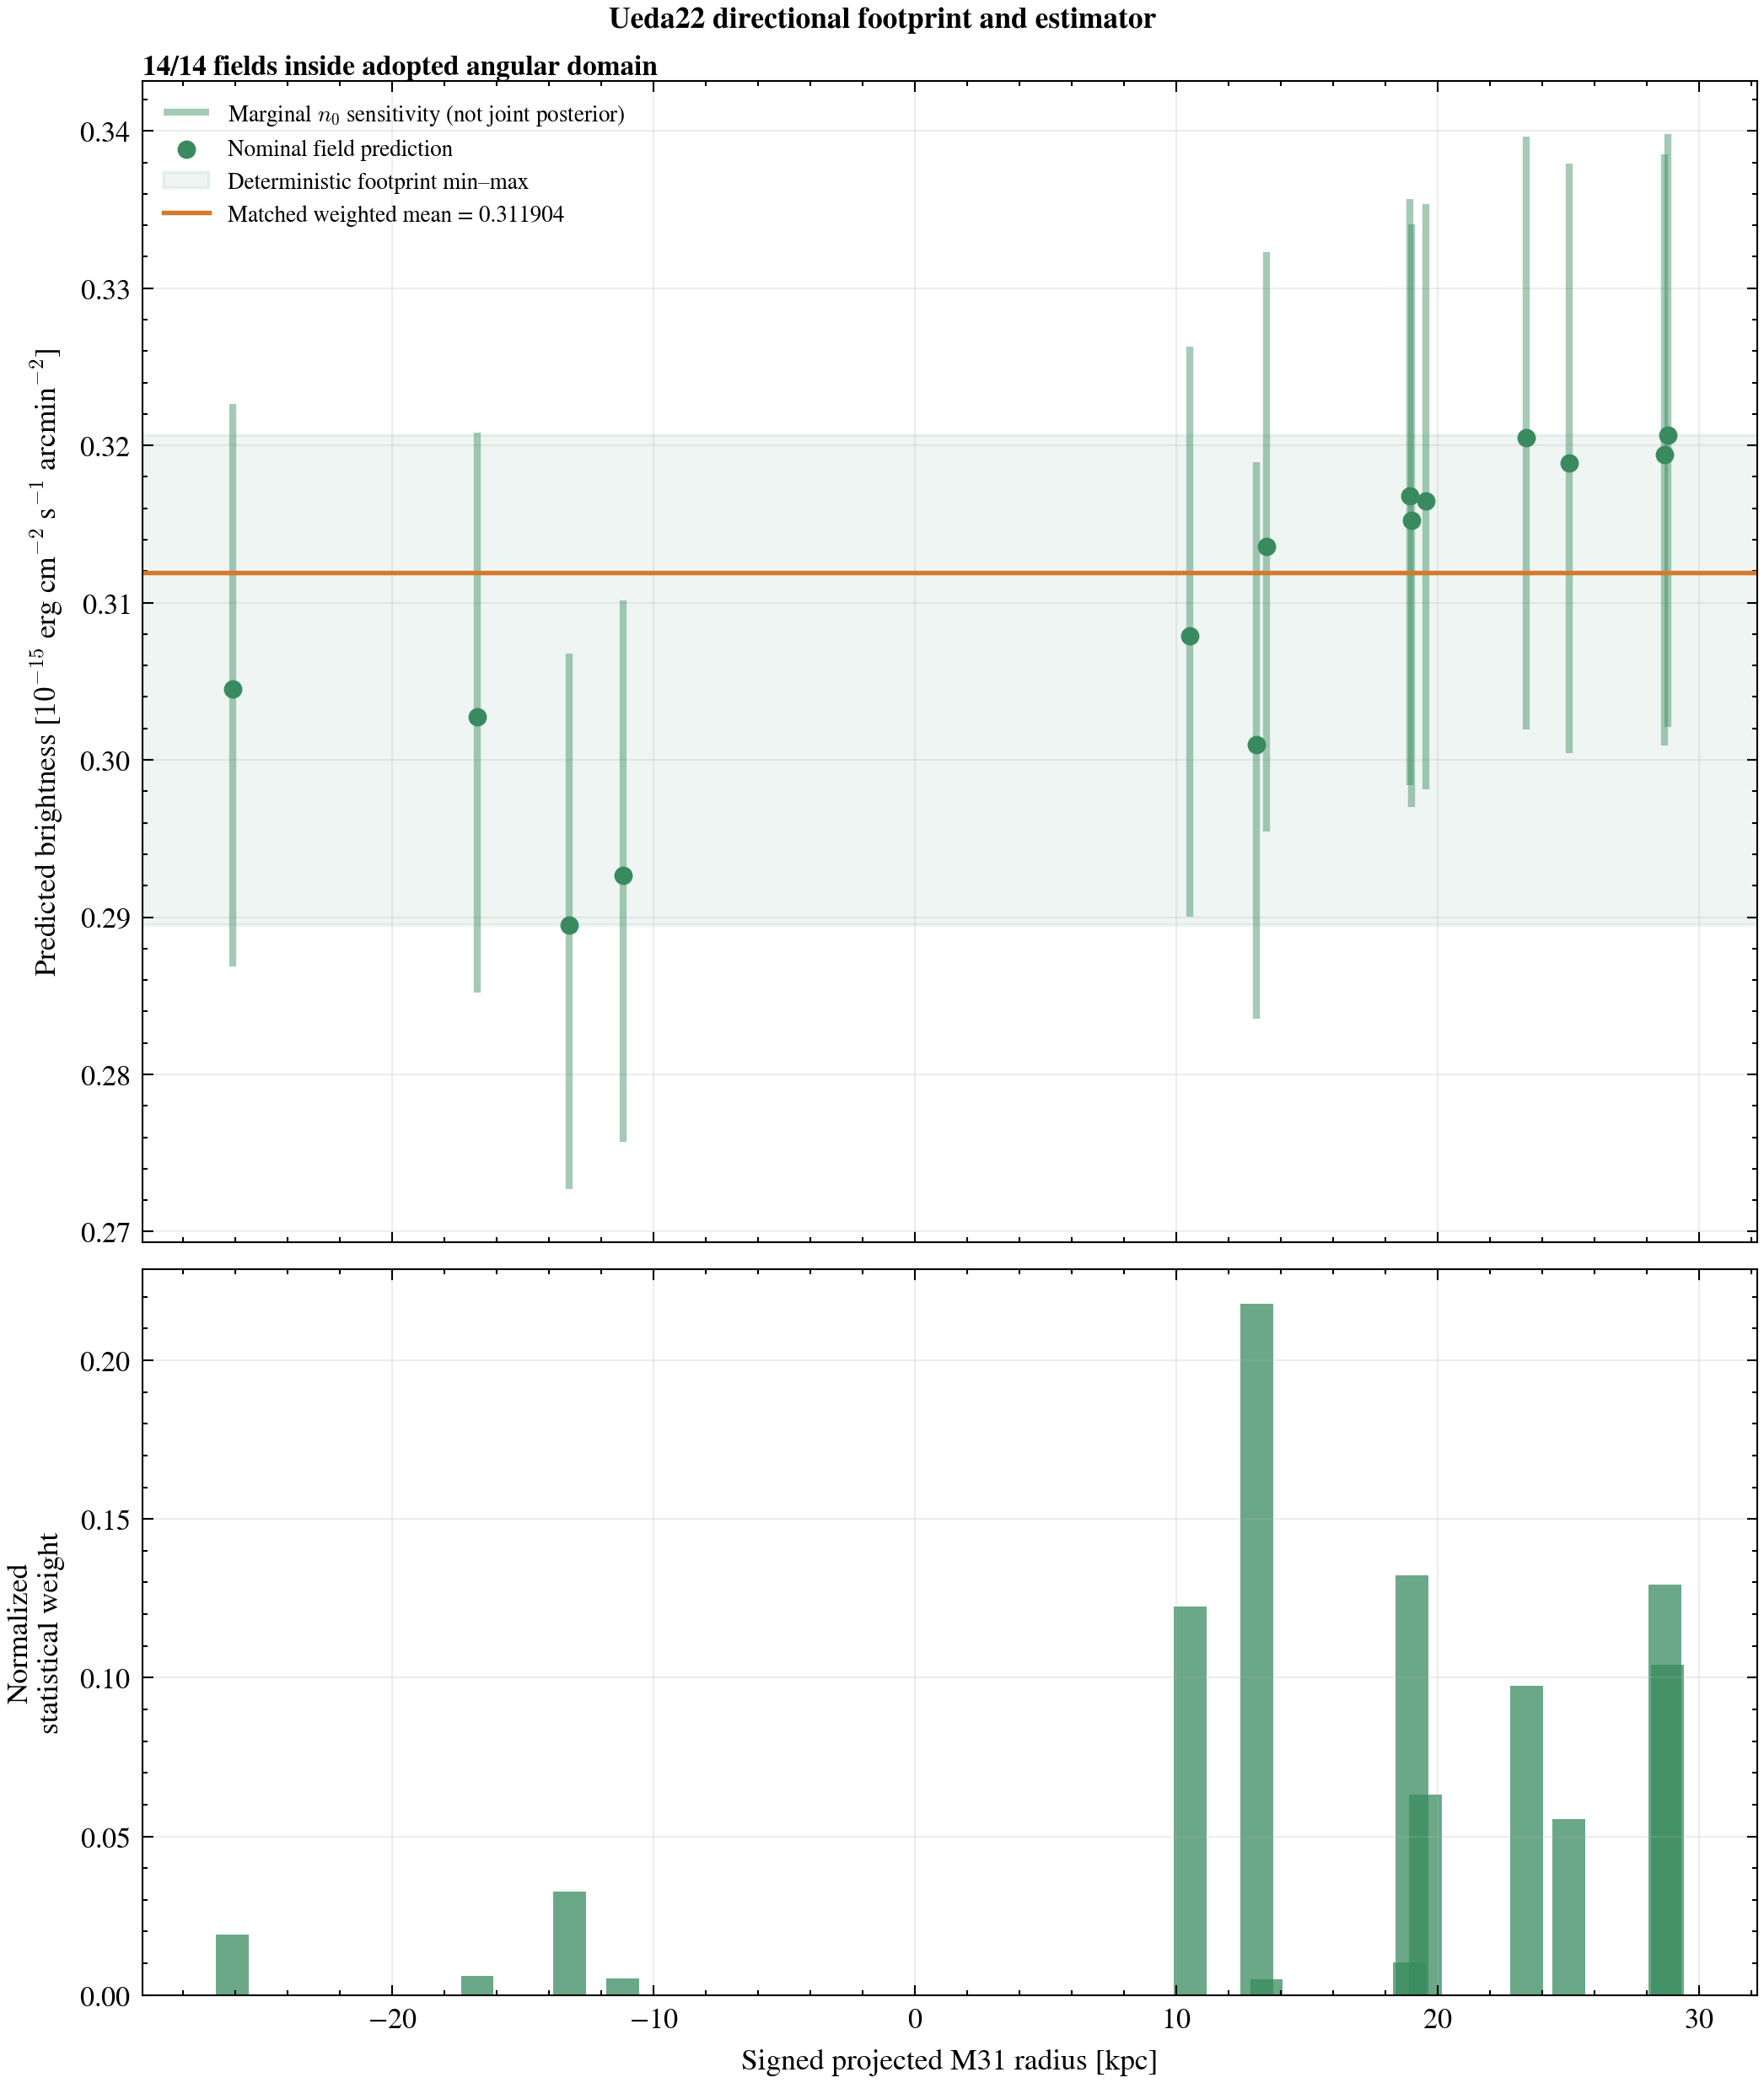
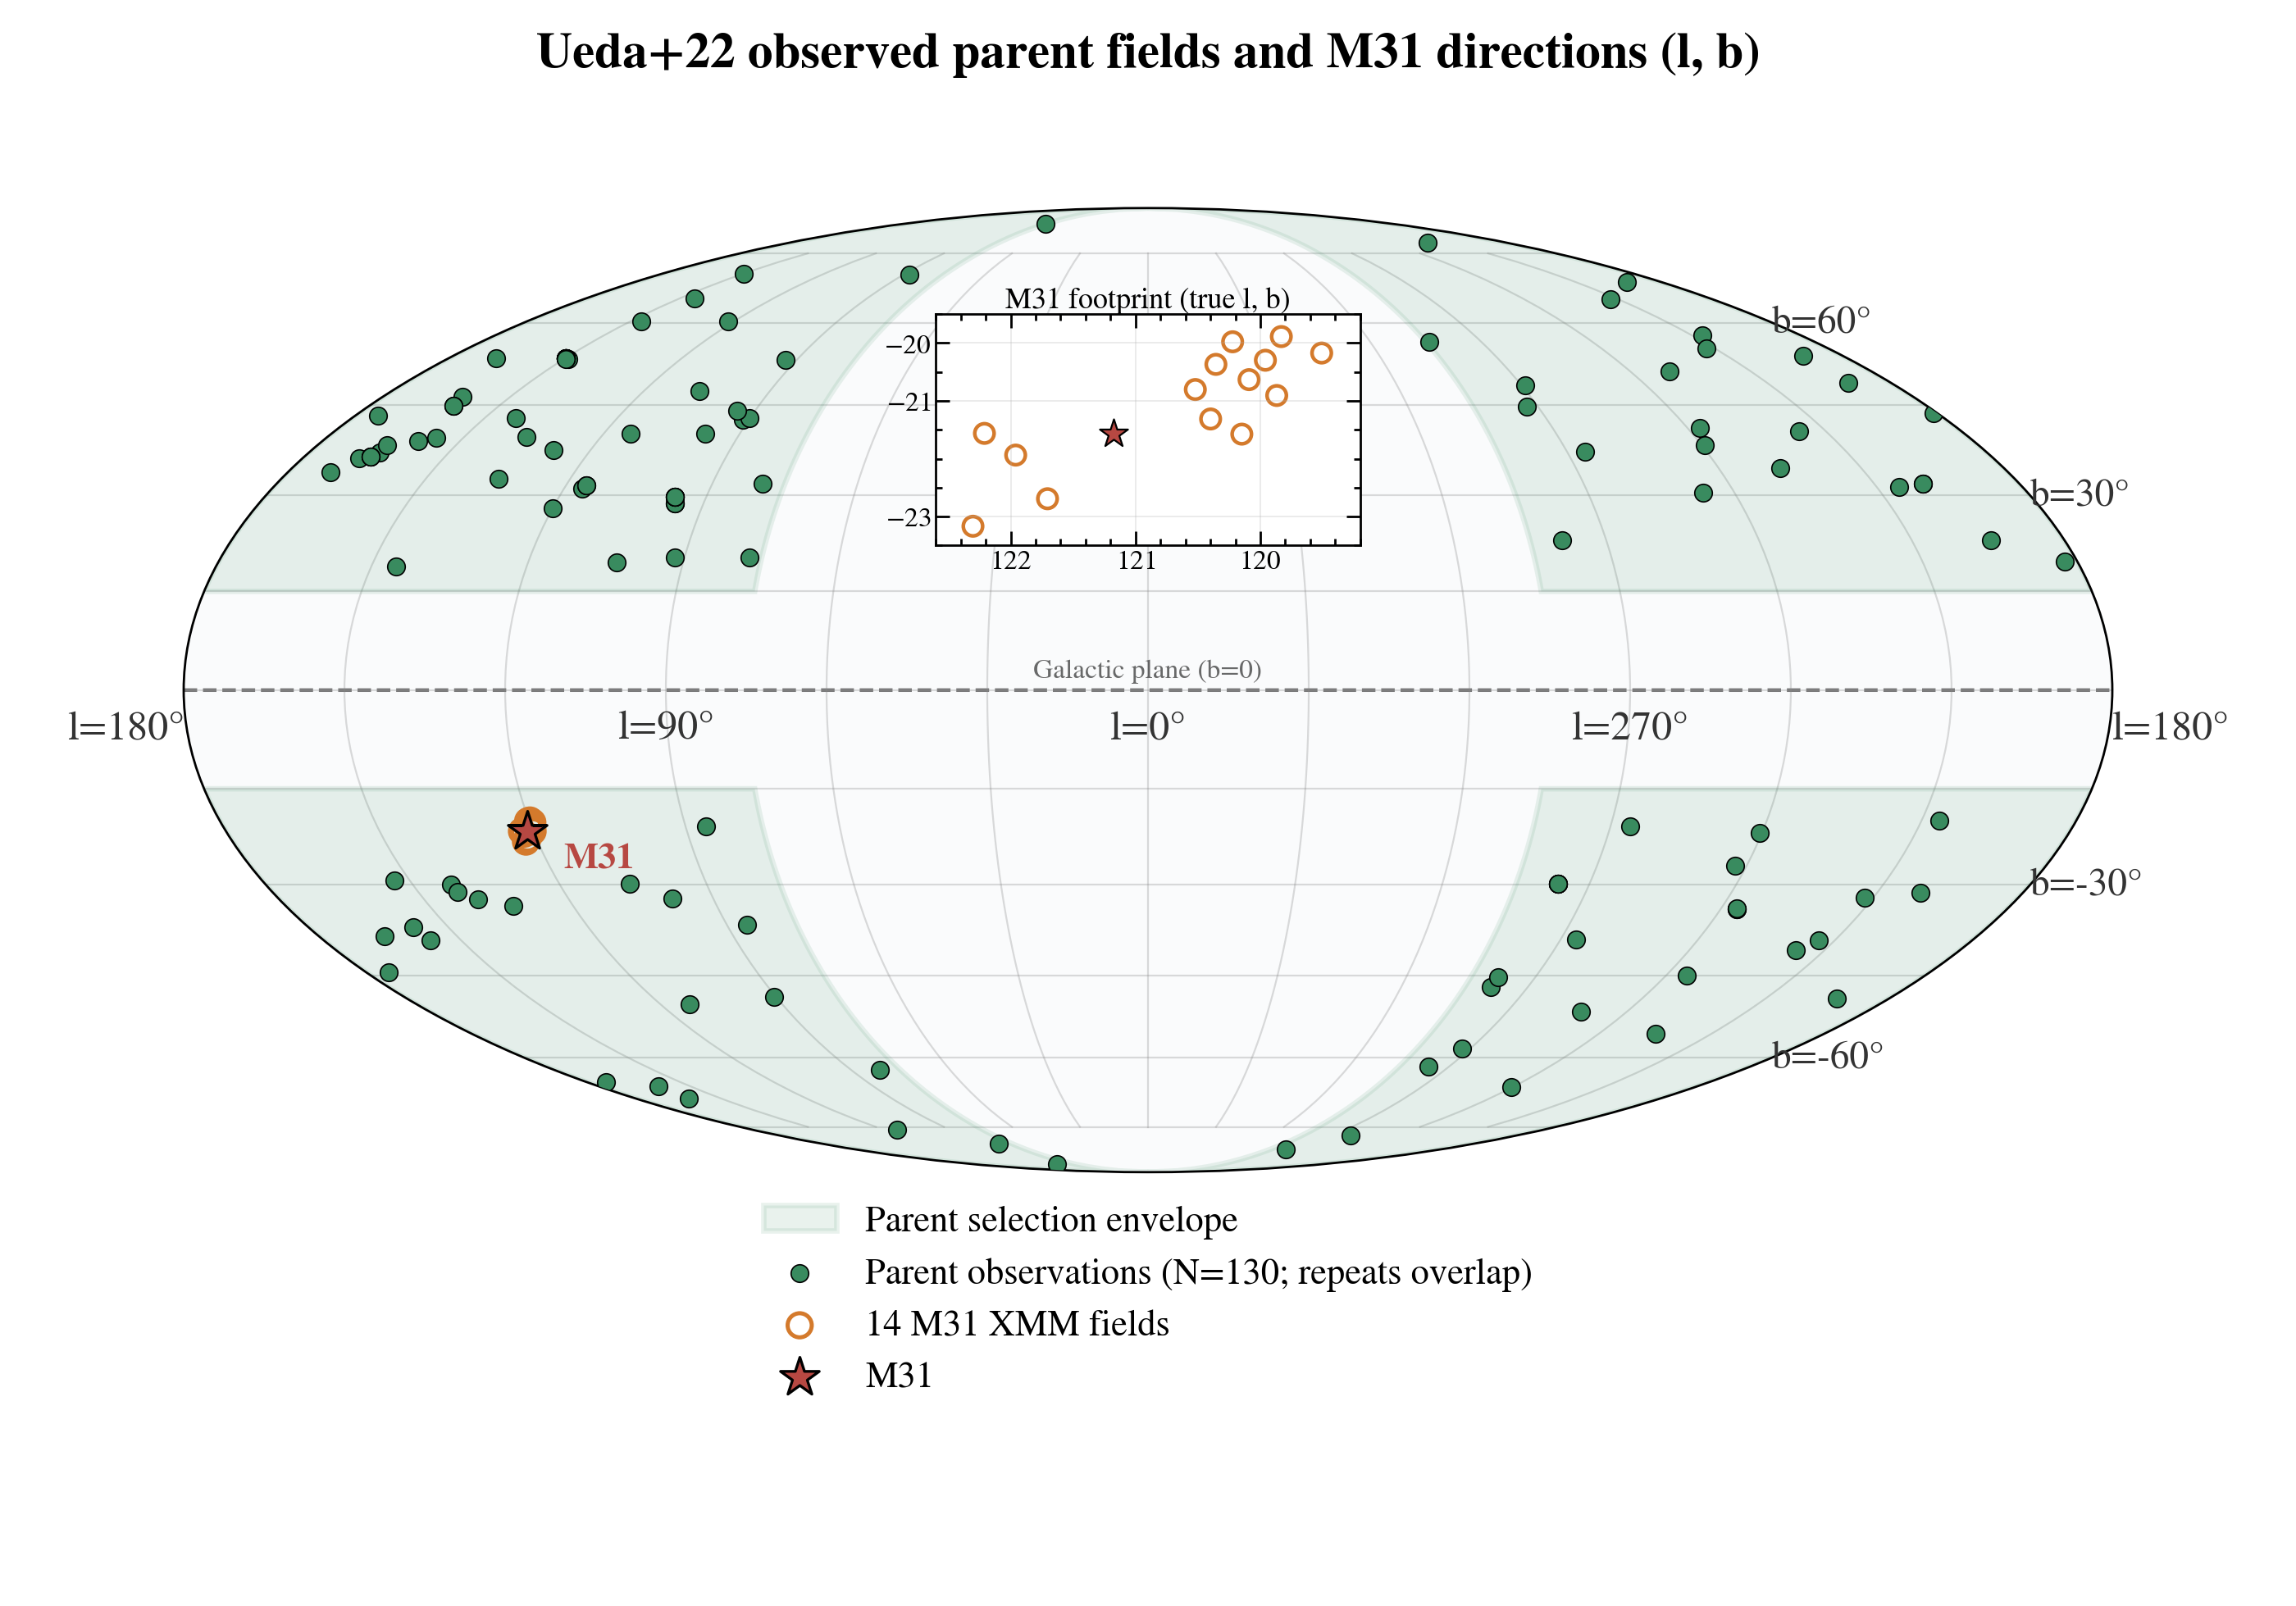
Ueda et al.用Suzaku软X射线背景spectra拟合约0.22 keV Milky-Way-halo component,并给出可沿任意内部视线积分的指数disk density model。M31十四场位于采用fit row的角域内。
Ueda et al. use Suzaku soft-X-ray-background spectra to fit an approximately 0.22 keV Milky-Way-halo component and publish an exponential disk density model that can be integrated along internal sightlines. All fourteen M31 fields lie within the angular domain of the adopted fit row.
out-of-domain directional extrapolation
Kaaret et al.用HaloSat南天高纬EM分布比较disk与halo morphology,得到disk-dominated且需要patchiness的结论。Figure 3把最终empirical-disk+adiabatic-halo model域外外推到M31。
Kaaret et al. compare disk and halo morphologies using southern high-latitude HaloSat emission measures, finding disk-dominated emission with patchiness. Figure 3 extrapolates the final empirical-disk-plus-adiabatic-halo model outside its fitted domain to M31.
western-half O VIII model extrapolated to the M31 footprint
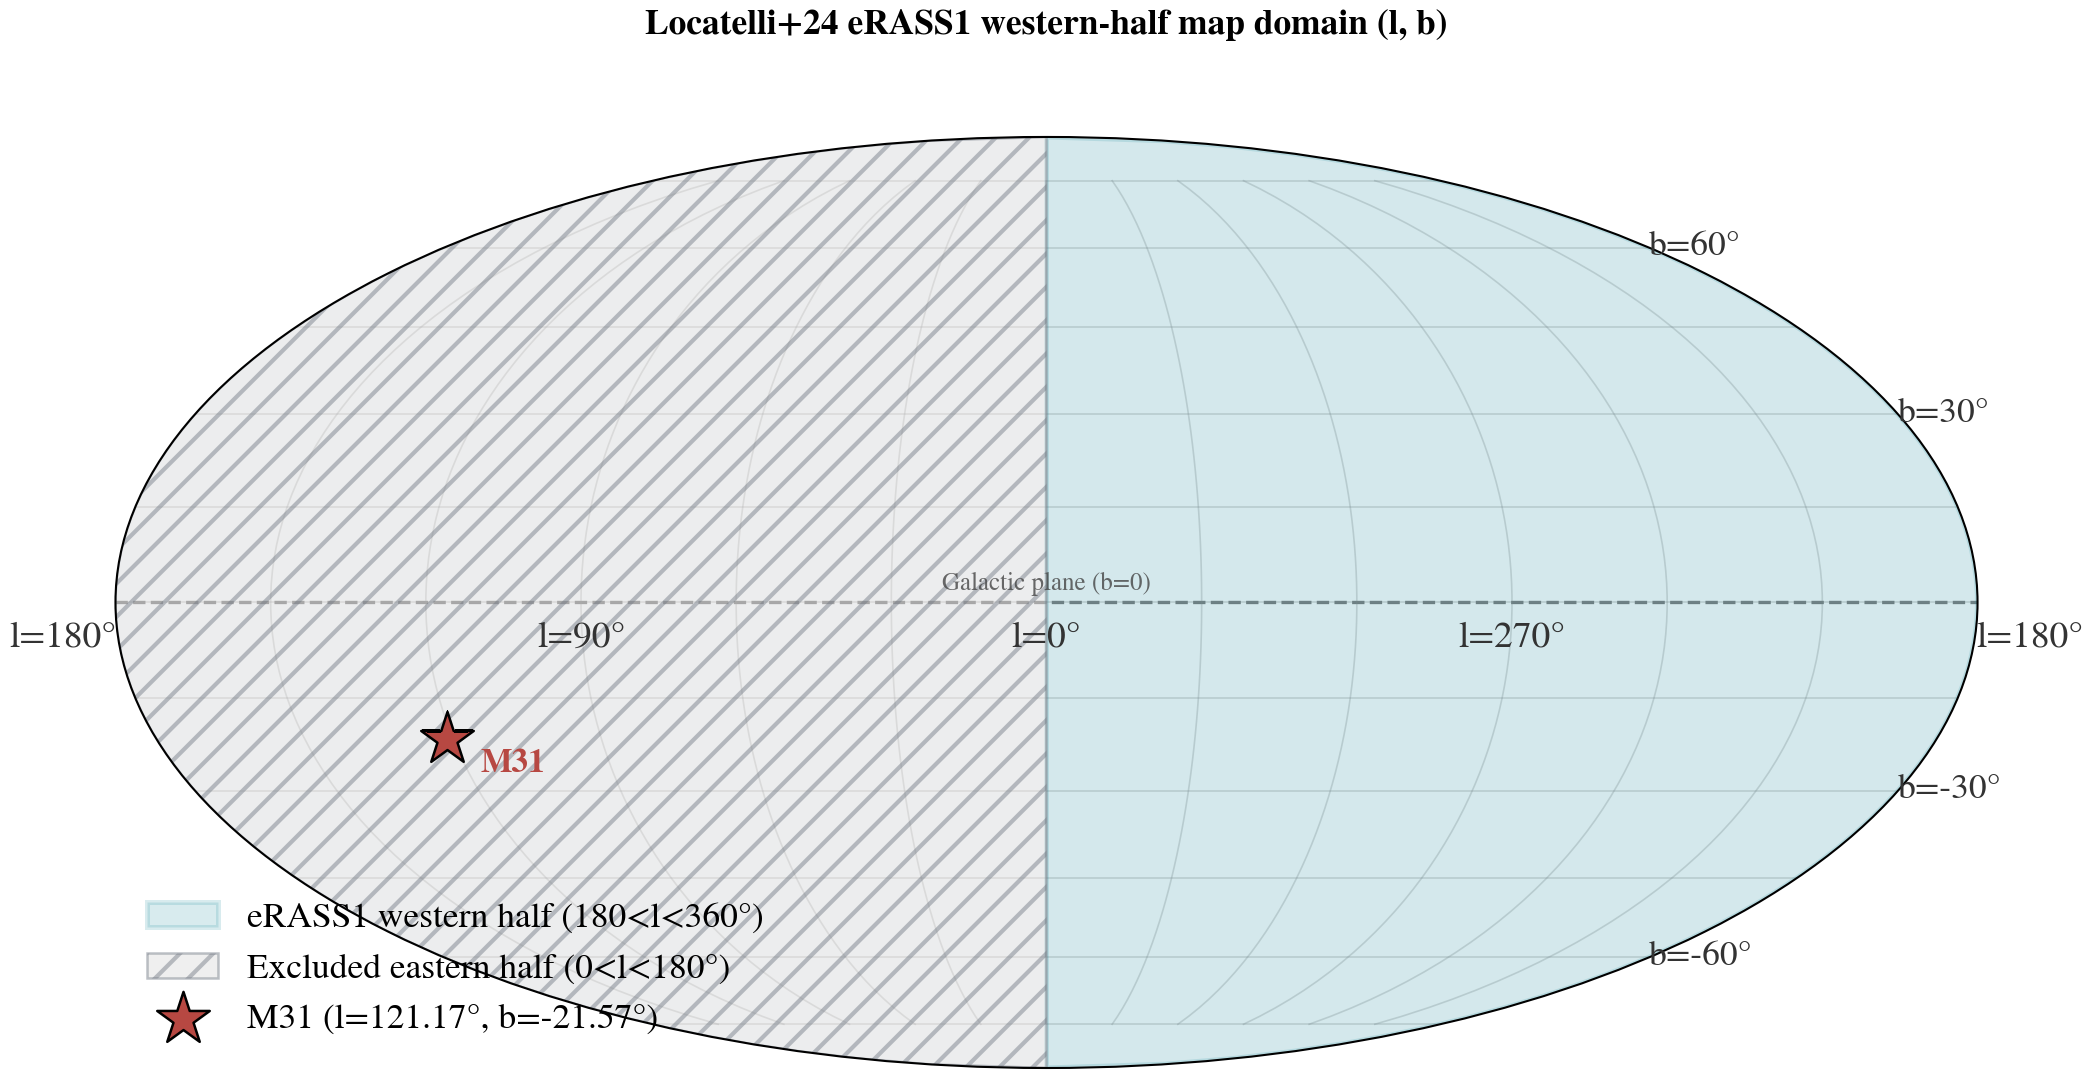
Locatelli et al.用eROSITA O VIII line map拟合Milky-Way warm-hot CGM的spherical-halo与exponential-disk几何。Figure 3的橙线不是论文表中的broadband flux,而是把named reference Combined beta=0.5 geometry转移到十四条M31视线。
Locatelli et al. fit spherical-halo and exponential-disk geometries to an eROSITA O VIII line map of the Milky-Way warm-hot CGM. The orange Figure 3 line is not a tabulated broadband flux; it transfers the named reference Combined beta=0.5 geometry through fourteen M31 sightlines.
external-galaxy population-stack template
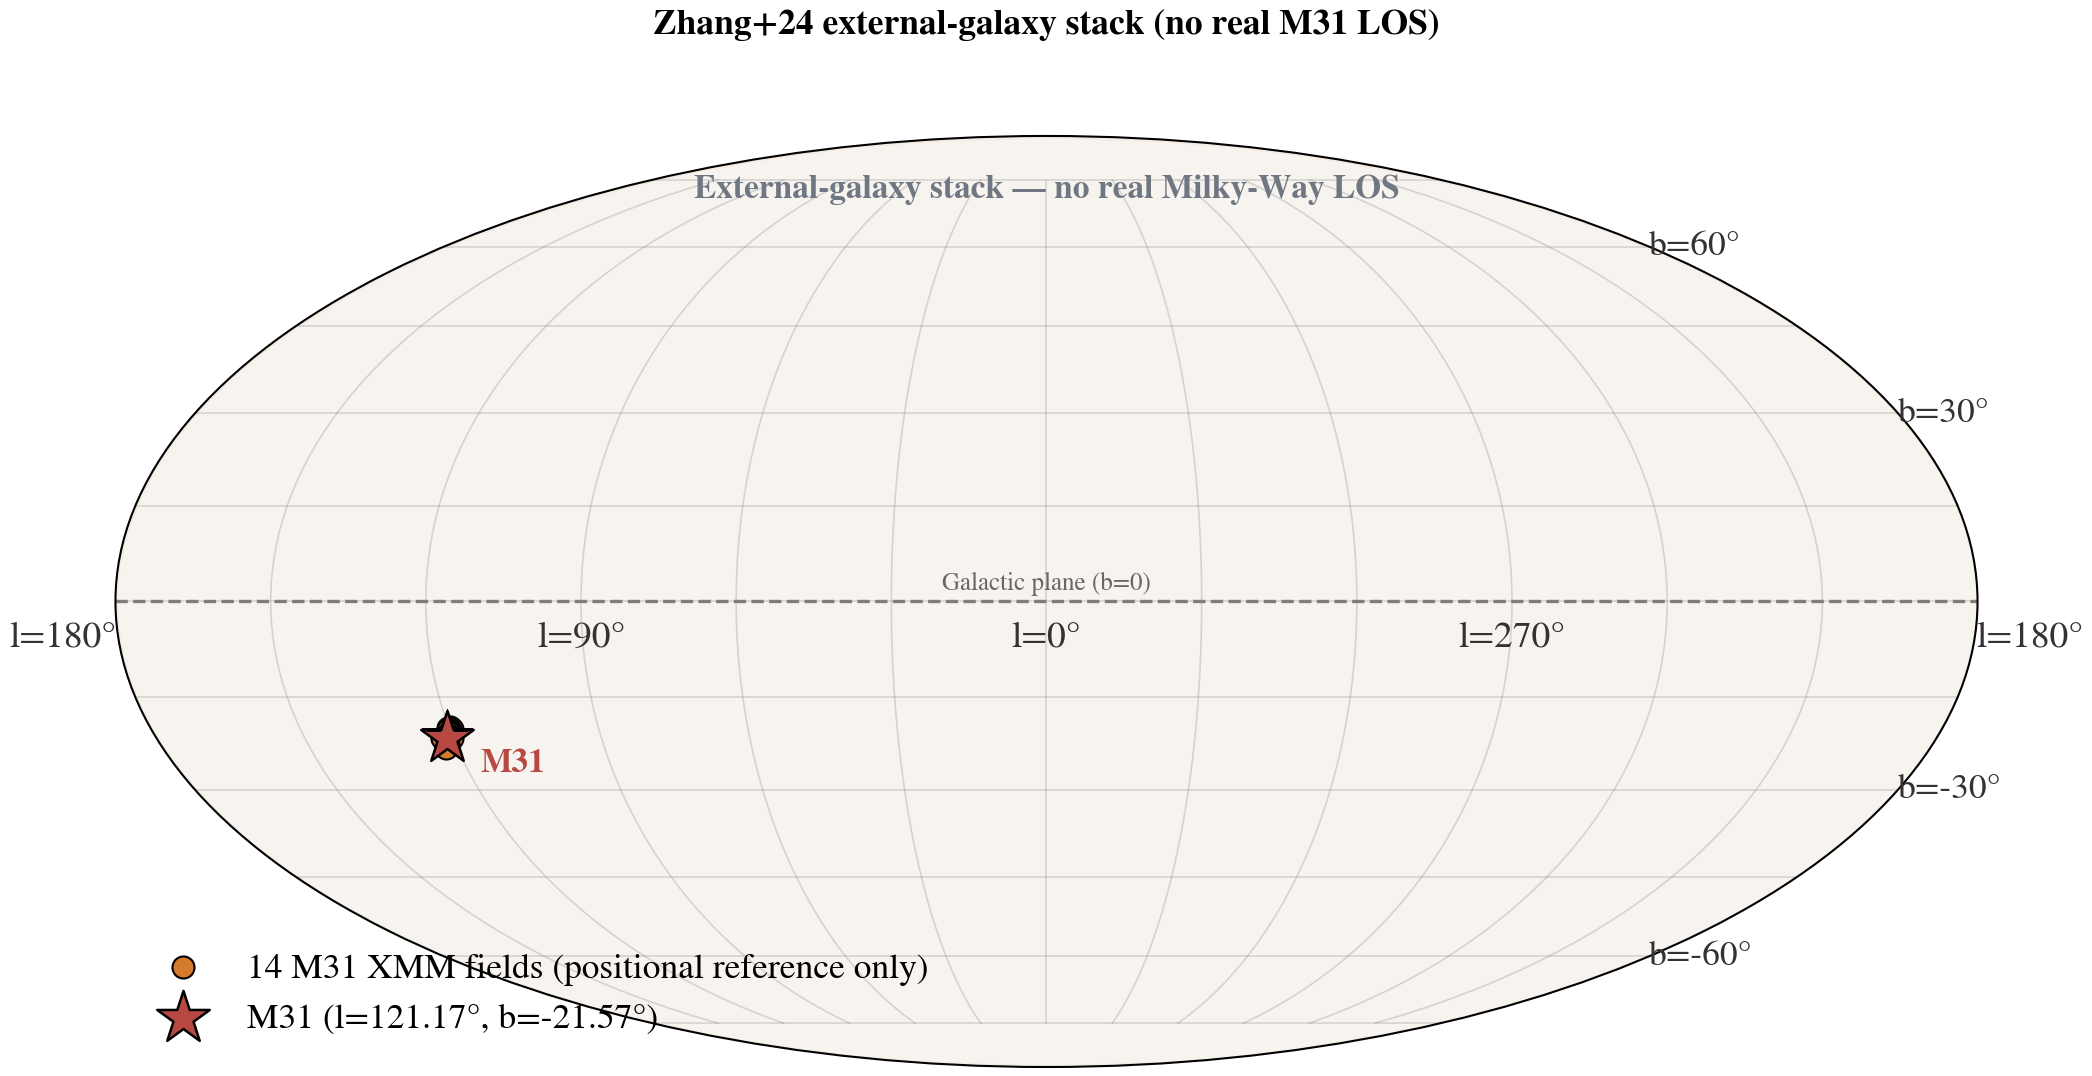
Zhang et al.把大量central galaxies的eROSITA photons按stellar-mass bins堆叠,统计分离hot-CGM、unresolved AGN/XRB/satellites与PSF。Figure 3使用M31-mass bin的population profile作为条件模板,不是M31本身的观测。
Zhang et al. stack eROSITA photons around large samples of central galaxies in stellar-mass bins, statistically separating hot CGM, unresolved AGN/XRB/satellites, and the PSF. Figure 3 uses the M31-mass-bin population profile as a conditional template, not an observation of M31 itself.
simulation profile comparison
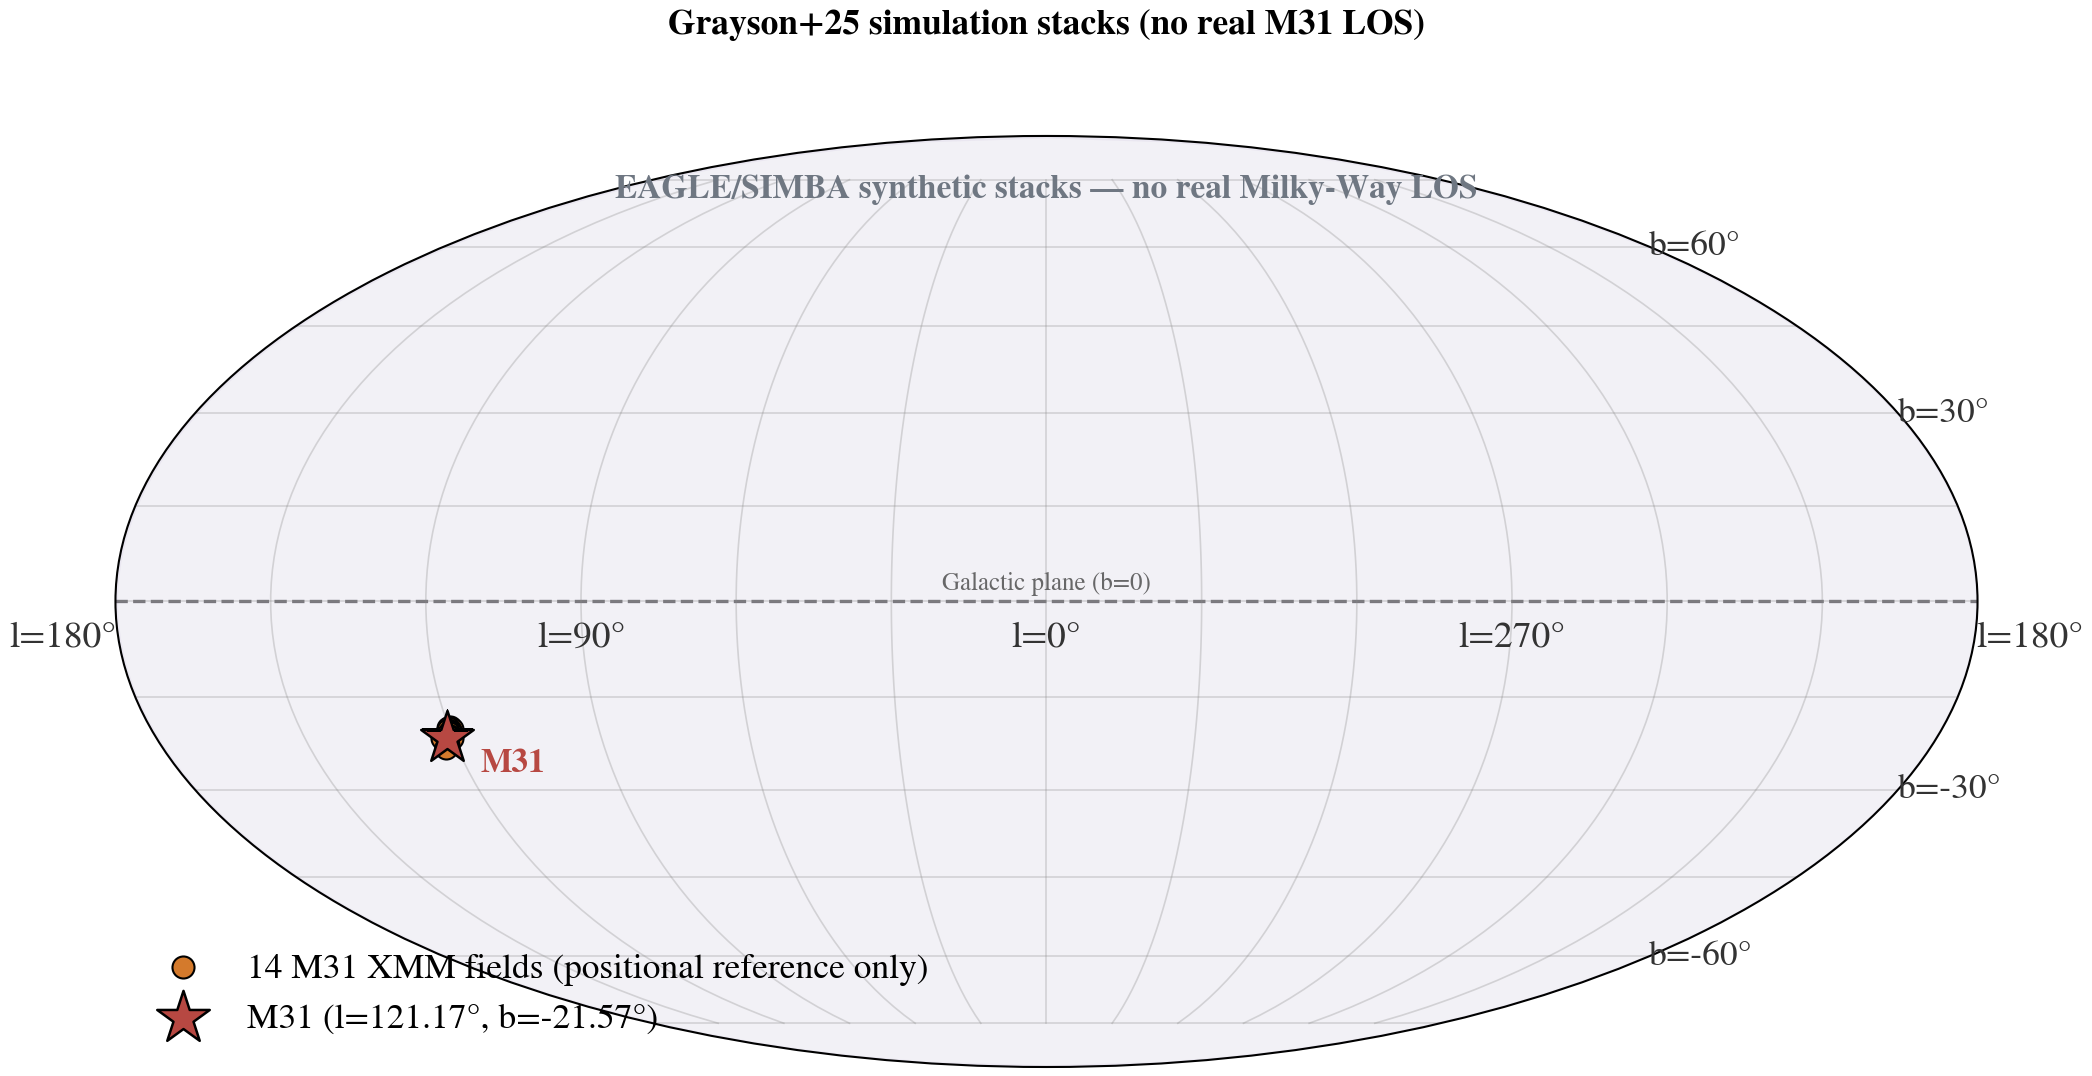
Grayson et al.把eROSITA stacked profiles与EAGLE和SIMBA的synthetic X-ray profiles比较,包含标准、强AGN heating及NoAGN variants。Figure 3把M31-mass stellar bin的10-30 kpc simulation bands逐个作为条件模板。
Grayson et al. compare eROSITA stacked profiles with synthetic X-ray profiles from EAGLE and SIMBA, including standard, stronger-AGN-heating, and NoAGN variants. Figure 3 uses each 10-30 kpc simulation band in the M31-mass stellar bin as a separate conditional template.
五组MW结果采用镜像M31模板的几何语法:central value或scenario画成贯穿绘图区的竖线,range沿x方向画成带竖向caps的横向bars。它们只固定x=SMW;bars的纵向错开是axes-fraction layout coordinates,并不沿y轴提供额外测量。真正的y=SM31条件模板仍是Zhang/Grayson水平线与竖向error bars。
All five MW results mirror the M31-template grammar: a central value or scenario is a full-height vertical line, while each range is a horizontal bar with vertical caps. The bars constrain only x=SMW; their staggered vertical offsets are axes-fraction layout coordinates and add no y-axis measurement. The true y=SM31 conditional templates remain the Zhang/Grayson horizontal lines with vertical error bars.
Locatelli 的高值来自一个具体转换链:采用论文指定的 reference Combined β=0.5 geometry,将 nh²+nd² 沿14条真实视线从太阳位置积分,得到4.14–4.56 L.U. 的 intrinsic O VIII 0.614–0.694 keV intensity;再用80 eV FWHM Gaussian smoothing 匹配原始 O VIII map 的能量处理。冻结CSV中的 response-matched self-check scale 为0.9498760469603238。最终 Figure 3 不是继续使用 published Z=0.1 broadband,而是固定这条 O VIII line normalization,换成Z=0.3 target APEC,并用每个 pointing 的 HI4PI NH 做 full foreground screen phabs,得到absorbed 0.5–2.0 keV。
The high Locatelli value follows a specific conversion chain: use the paper-designated reference Combined β=0.5 geometry, integrate nh²+nd² from the Solar position through the 14 real sightlines, obtain intrinsic O VIII 0.614–0.694 keV intensities of 4.14–4.56 L.U., and match the original O VIII map treatment with an 80-eV-FWHM Gaussian smoothing. The frozen CSV gives a response-matched self-check scale of 0.9498760469603238. Figure 3 then does not reuse a published Z=0.1 broadband value; it holds that O VIII line normalization fixed, converts to a Z=0.3 target APEC model, and applies each pointing's HI4PI NH as a full foreground screen phabs to obtain absorbed 0.5–2.0 keV.
重算结果闭合:14场final values为1.158–1.341,North/South inverse-variance means为1.296/1.213,side-balanced辅助summary为1.255,all-field inverse-variance estimator为1.290。图中实心橙线采用1.290,因为它应与观测all-field total 0.965±0.044比较;因此超过all-field观测总量0.326,即约34%。这不是“测得的MW一定这么亮”,而是说明这个 named Locatelli conversion 与我们的 observed CGMsum total 不相容,或者原模型normalization/line-to-broadband/foreground-screen假设在M31低纬视线方向过高。它也不是posterior interval;14-field min–max只是footprint spread。
The recomputation closes: the 14 final field values are 1.158–1.341, the North/South inverse-variance means are 1.296/1.213, the side-balanced auxiliary summary is 1.255, and the all-field inverse-variance estimator is 1.290. The solid orange line uses 1.290 because it is compared with the observed all-field total, 0.965±0.044; it therefore exceeds the all-field observed total by 0.326, or about 34%. This does not mean the MW brightness has been measured to be exactly that high; it means this named Locatelli conversion is inconsistent with our observed CGMsum total, or that its normalization, line-to-broadband conversion, or foreground-screen assumption is too high for this low-latitude M31 direction. It is not a posterior interval; the 14-field min–max is only footprint spread.
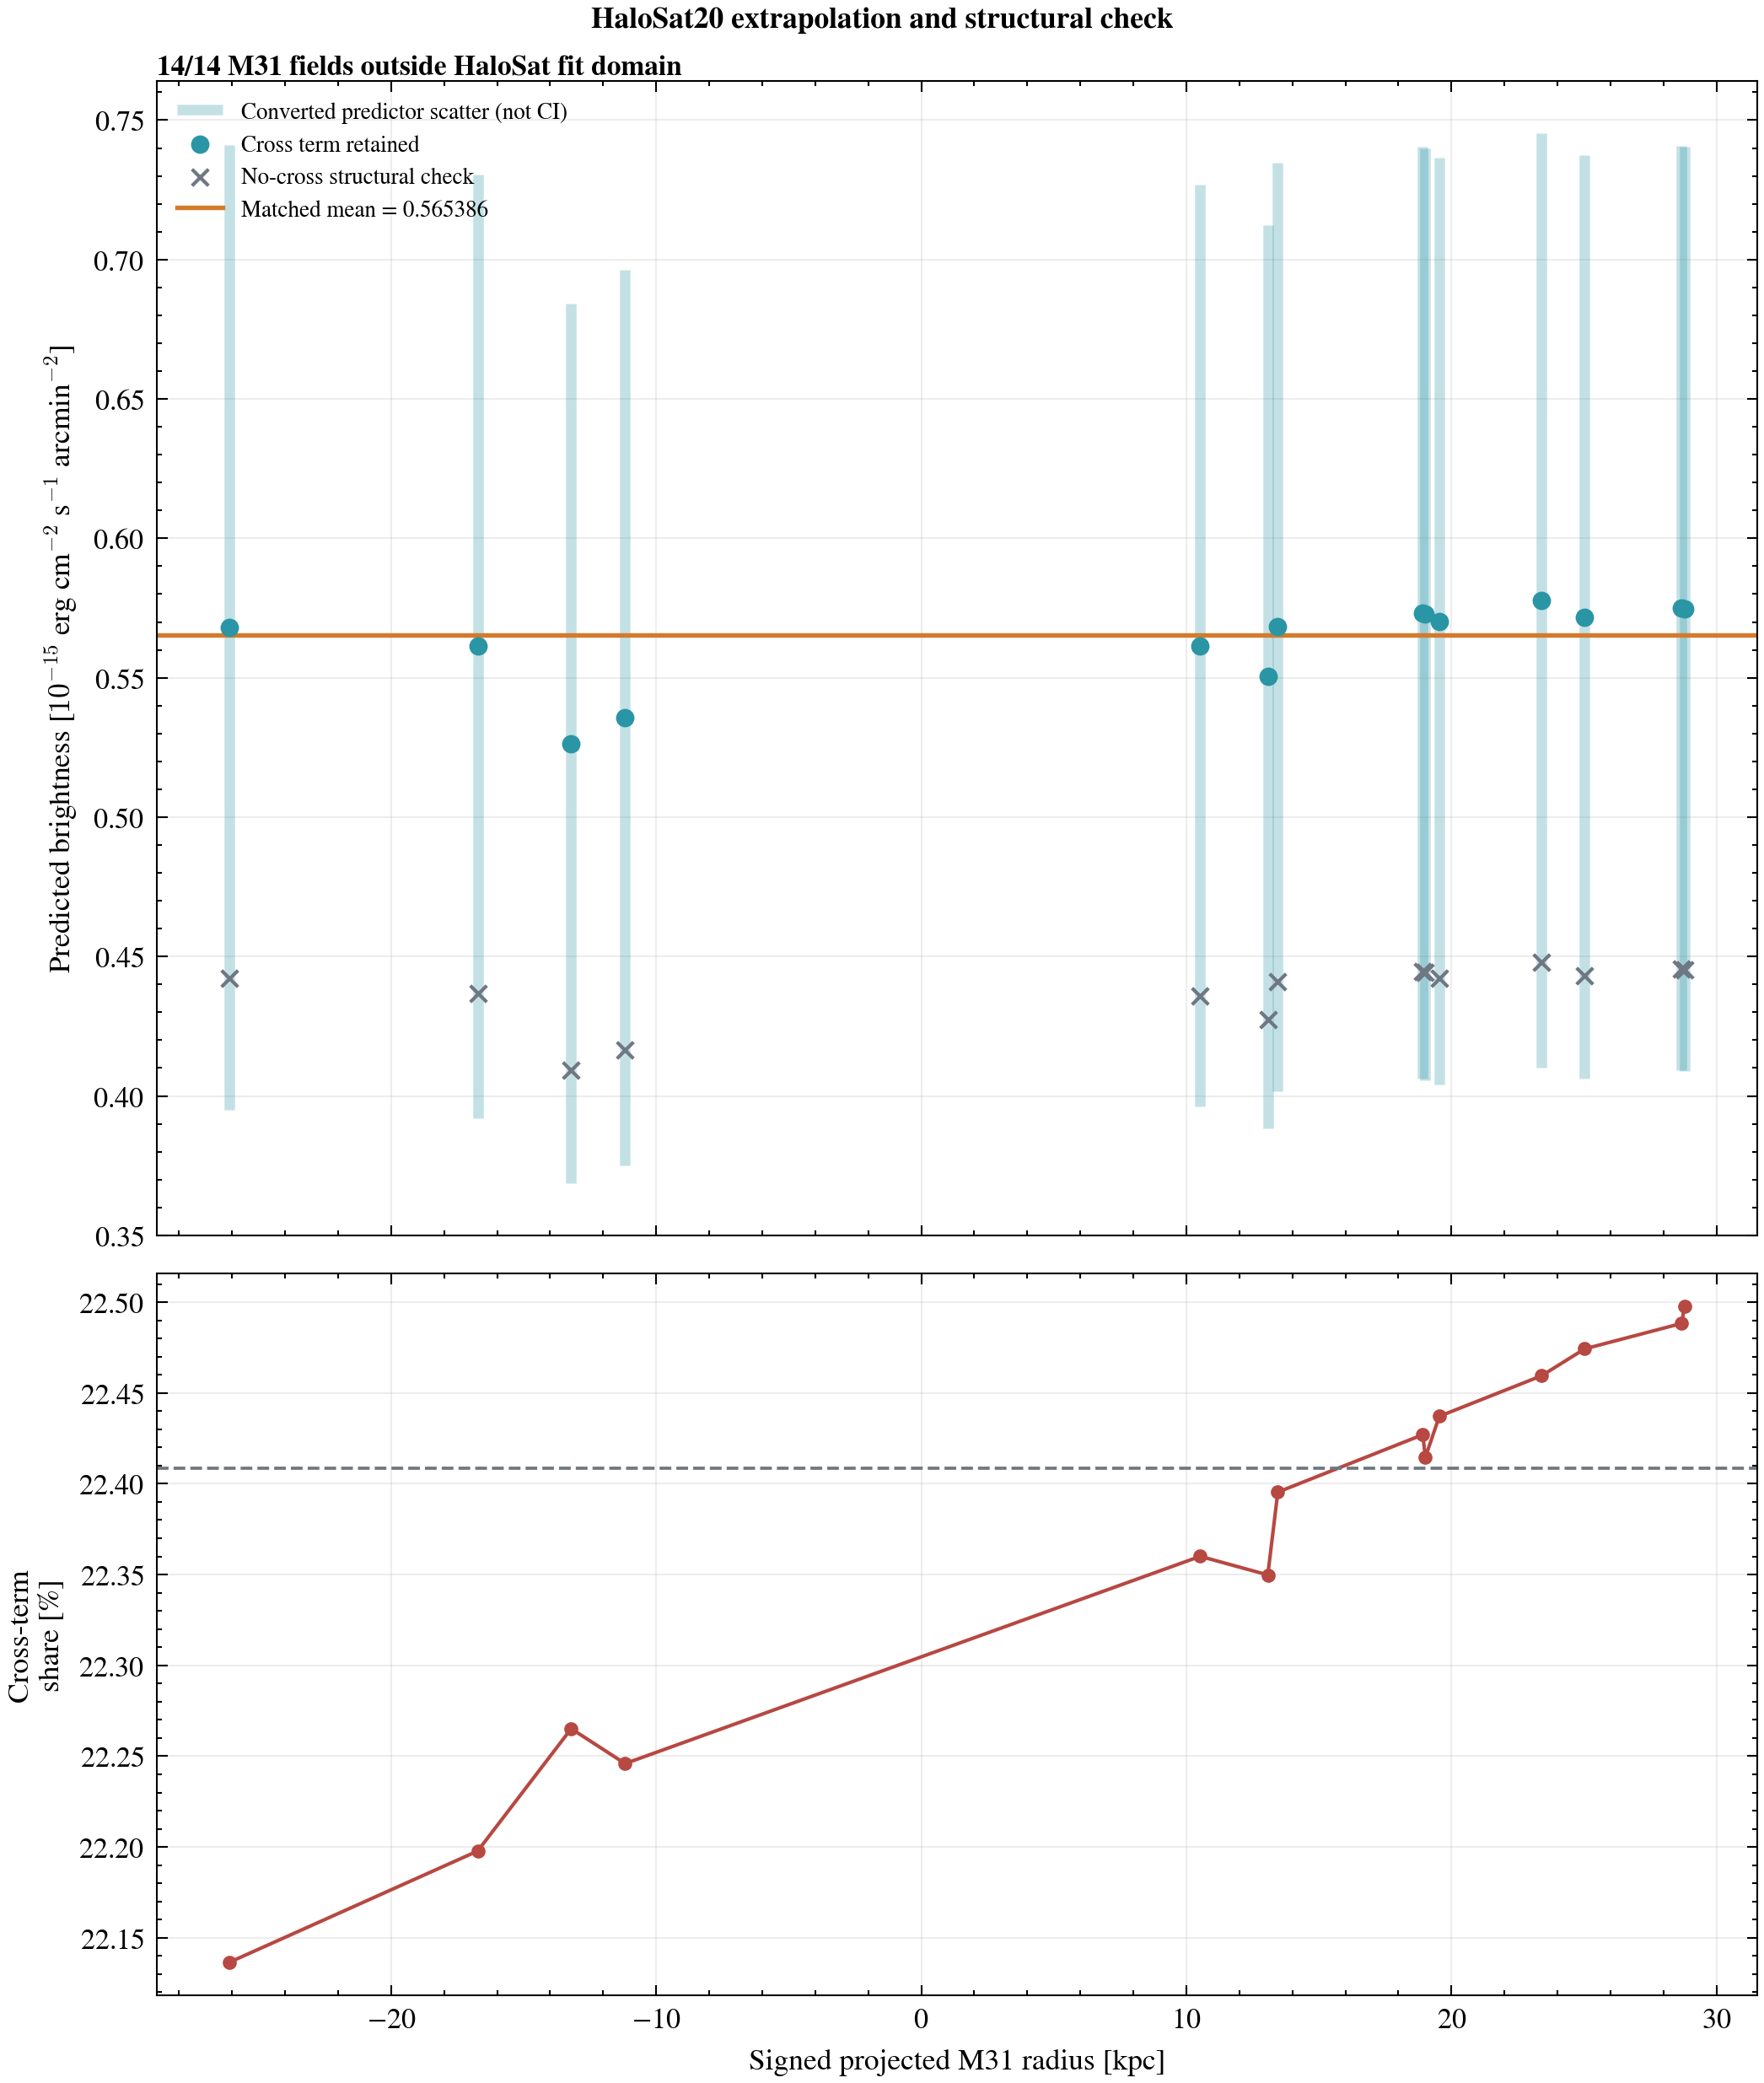
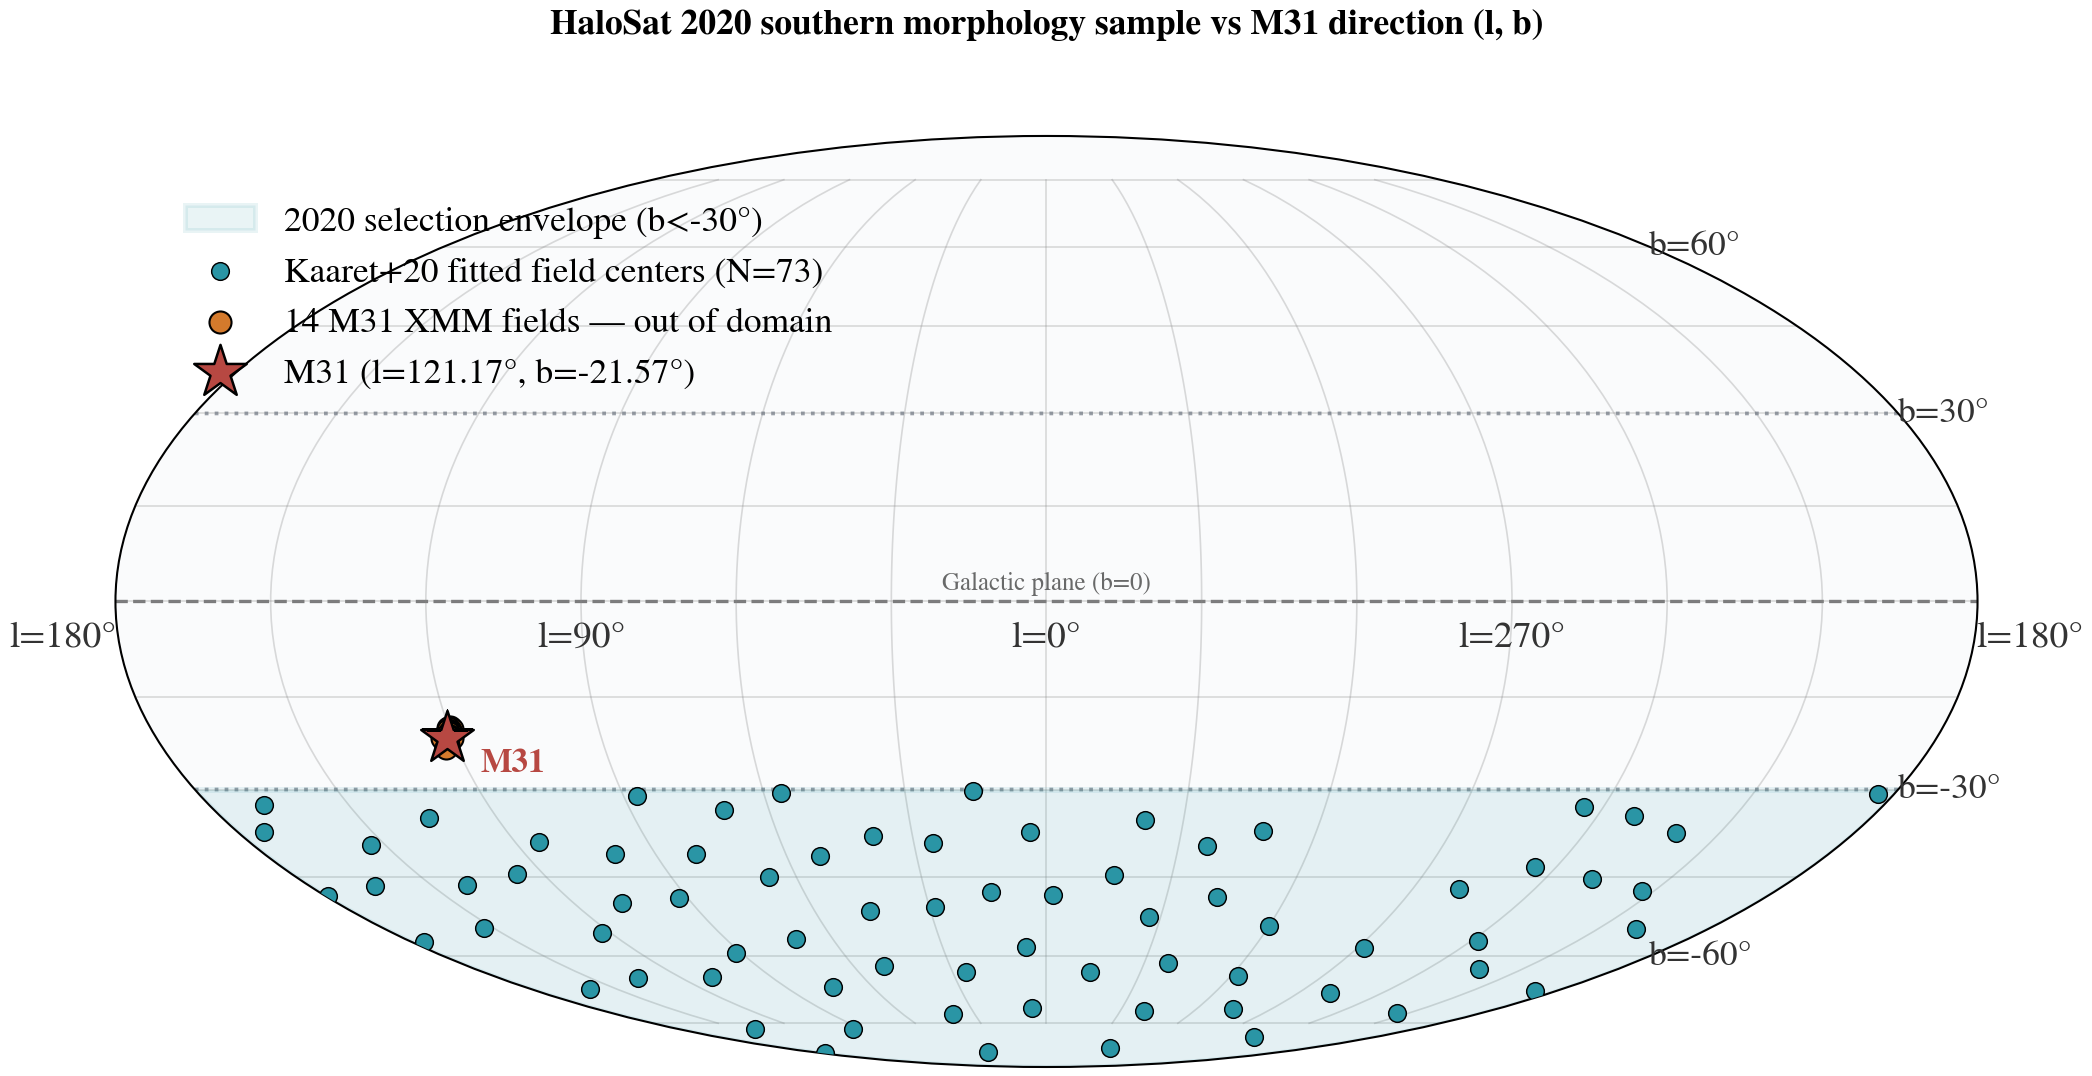
有,但要准确命名:Kaaret+20给出的是empirical disk + adiabatic halo,halo是在NFW势中静水平衡的多方气体,不是一个由全天数据拟合的通用spherical β component。73-field parent fit只使用南天 b<−30° 的HaloSat EM;M31十四场约在b=−21.6°,全部在拟合域外。最近的拟合场中心仍距M31 17.70°,超过HaloSat 7°零响应半径,因此没有观测重叠。模型几何可以算到M31方向,但结果只能作为supplemental extrapolation。
Yes, but it must be named precisely. Kaaret+20 fit an empirical disk plus an adiabatic halo, with the halo a hydrostatic polytrope in an NFW potential, not a generic spherical beta component calibrated by full-sky data. The 73-field parent fit used only southern HaloSat emission measures at b<−30°. All 14 M31 fields are outside the original southern-sky fit domain near b=−21.6°. The nearest fitted field center is still 17.70° from M31, beyond HaloSat's 7° zero-response radius, so there is no observational overlap. The result is only a supplemental extrapolation.
本页采用论文best fit:nd=0.0081 Σ(R) exp(−|z|/1.60 kpc),halo使用Fang+13 adiabatic profile和ρV=4.8×10⁻⁵ cm−3,积分到260 kpc。对73场复现published χ²要求published-fit n² convention:EMmodel=∫(nd+nh)²ds并保留cross term;论文没有说明fitted n是ne、nH或其他particle density,因此不再额外乘1.2。band conversion明确补充sample median kT=0.225 keV、Z=0.3、Wilms+Verner TBabs和逐场HI4PI。得到all-field 0.565,14场0.526–0.578,patchiness predictor scale为±0.165;条件M31 complement为0.399。若去掉cross term,structural check为0.439。
The executable uses nd=0.0081 Σ(R) exp(−|z|/1.60 kpc), the Fang+13 adiabatic profile with ρV=4.8×10⁻⁵ cm−3, and integration to 260 kpc. Reproducing the published χ² for all 73 fields requires the published-fit n^2 convention, EMmodel=∫(nd+nh)²ds with the cross term retained. The paper does not identify fitted n as ne, nH, or another particle density, so no extra factor of 1.2 is applied. The band conversion adds sample-median kT=0.225 keV, Z=0.3, Wilms+Verner TBabs, and field-specific HI4PI. The result is 0.565 all-field, 0.526–0.578 across 14 fields, a ±0.165 patchiness predictor, and conditional M31=0.399. A no-cross-term structural check gives 0.439.
Bluem+22后来分析156个|b|>30°场,但没有为双温模型重新拟合spherical+disk geometry;gain correction使旧单温EM中位变化约15%。M31附近虽有HaloSat archive target,但未进入已发表高纬光谱目录,而且非成像大视场会包含M31弥散辐射,不能作为独立MW先验。
Bluem+22 later analyzed 156 fields at |b|>30° but did not refit a spherical+disk geometry for the two-temperature model; the gain correction changed the median legacy one-temperature EM by about 15%. A HaloSat archive target exists near M31, but it is absent from the published high-latitude spectral catalogs and its non-imaging field would contain M31 diffuse emission, so it is not an independent MW prior.
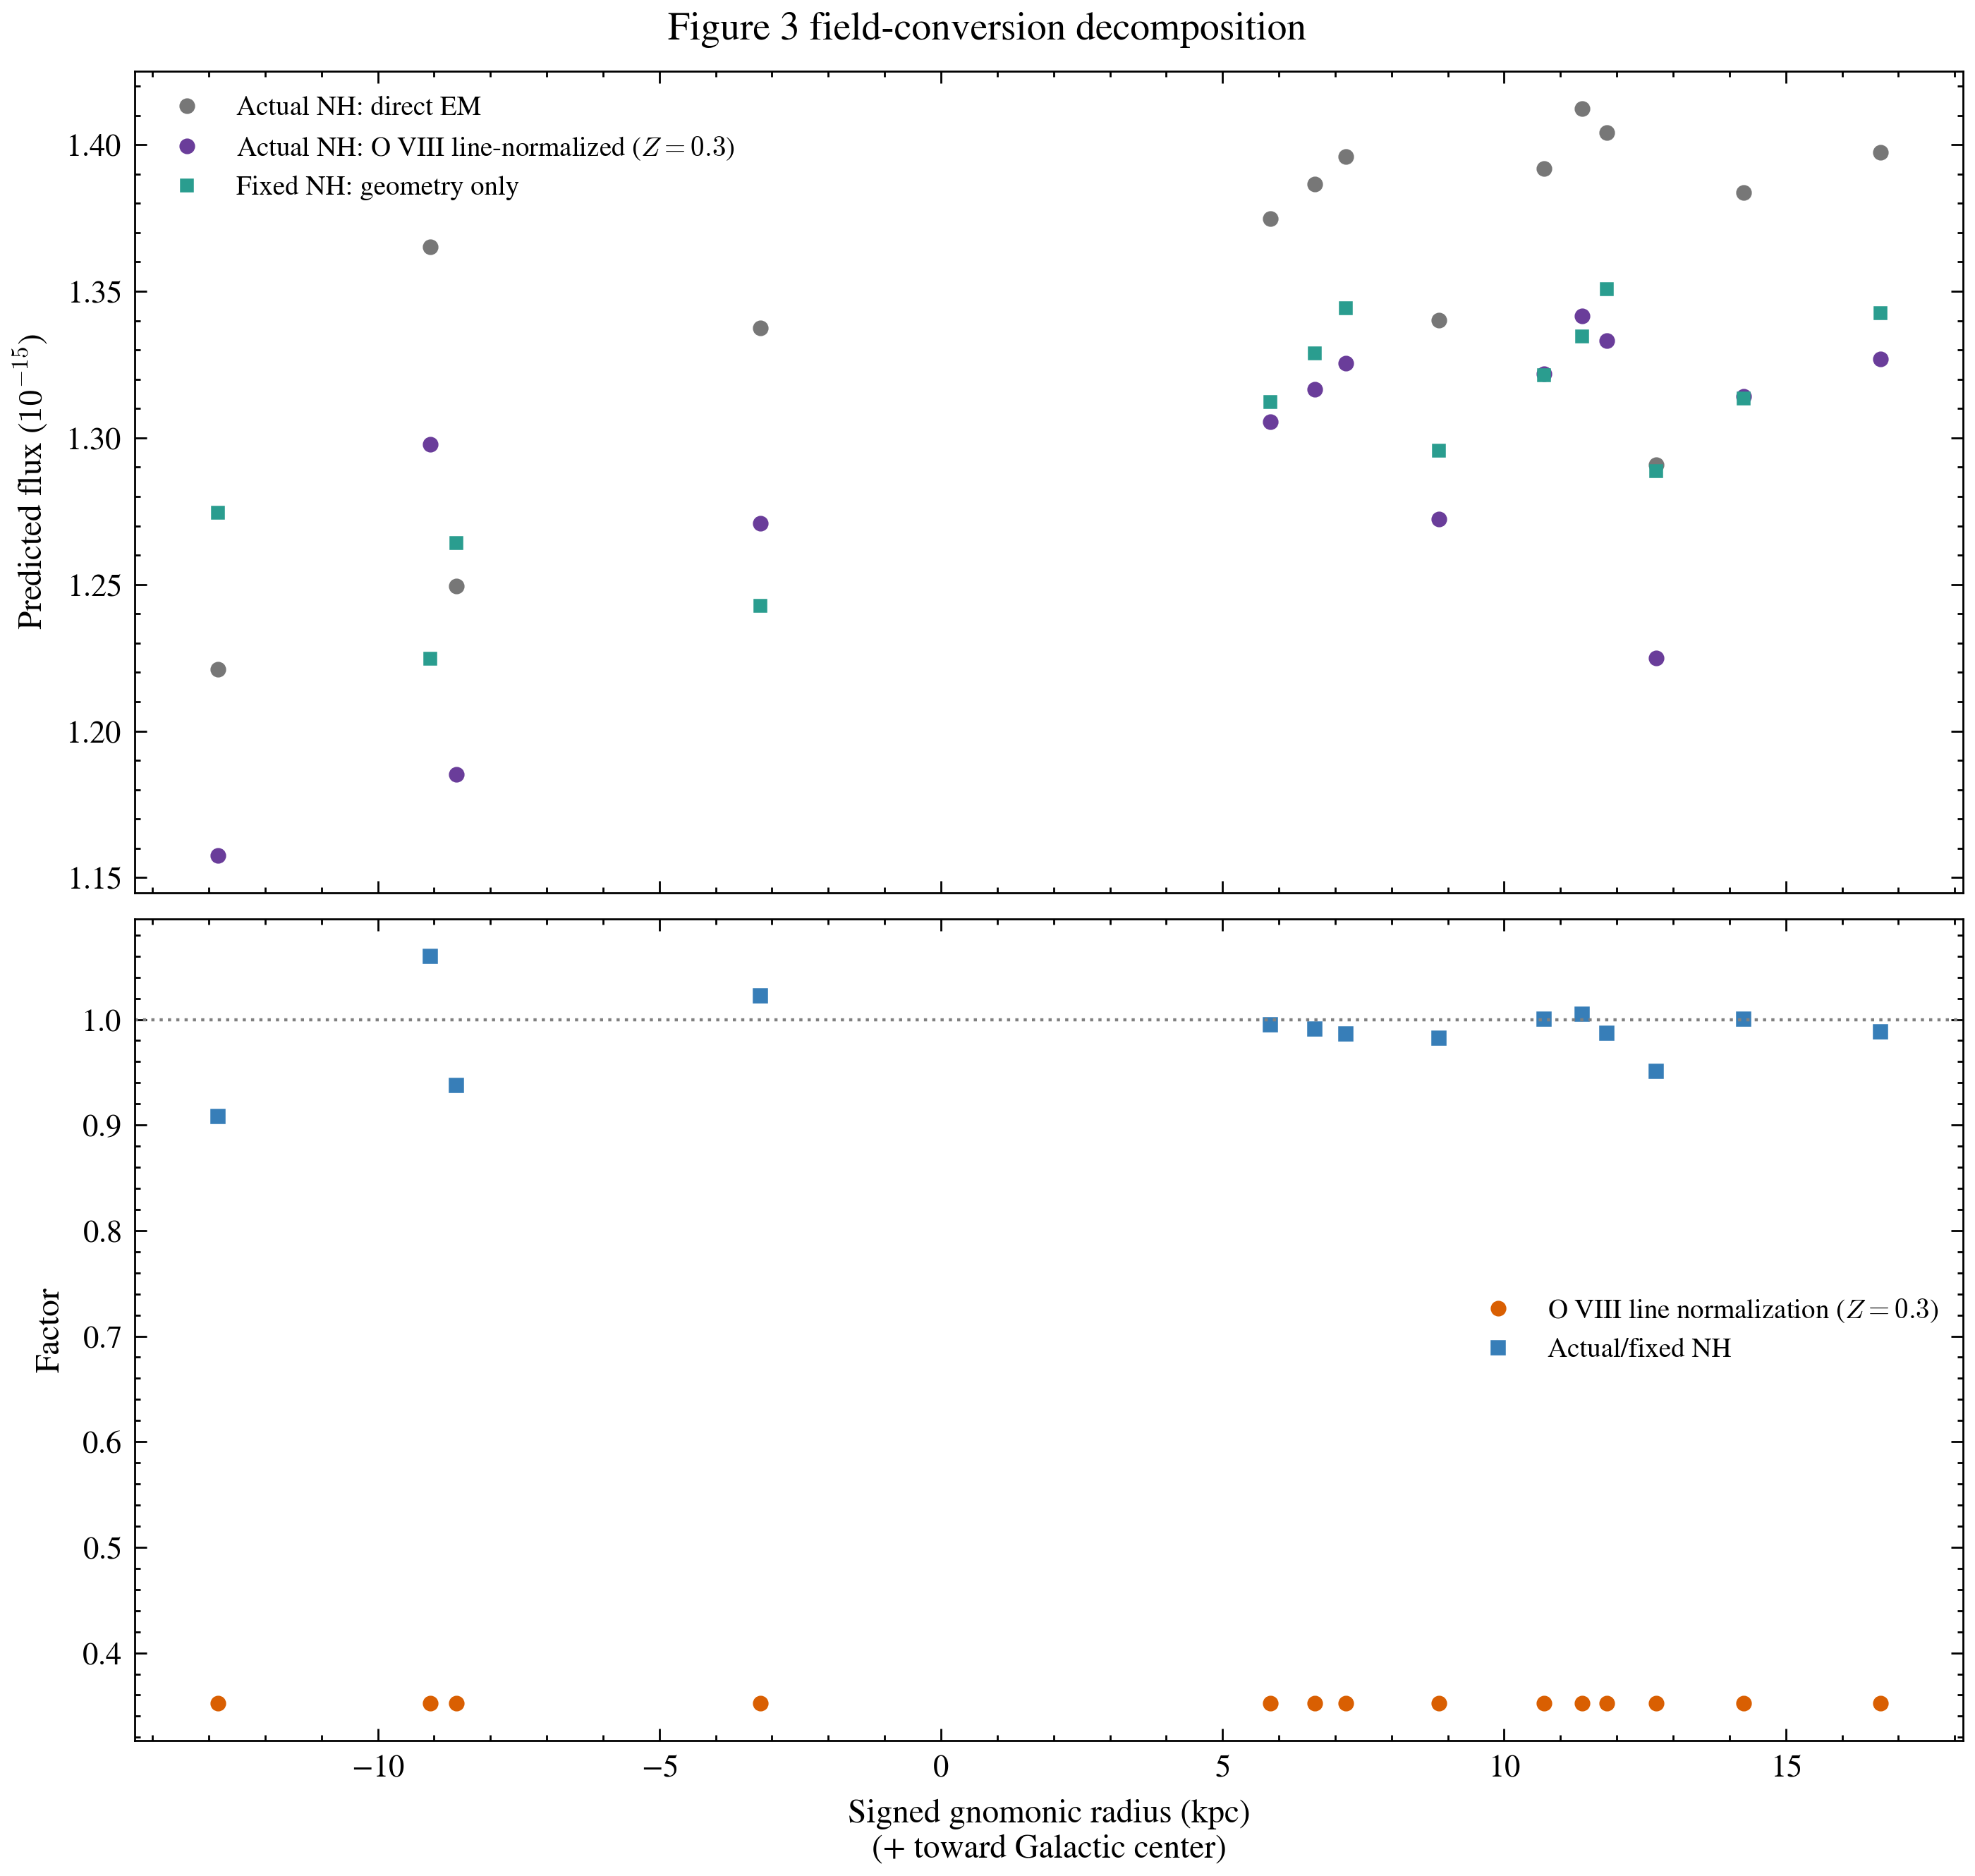
表中 observed 一列始终是 CGMsum。MW reference 列是 named model projection;二者没有被当成同一种数据。
The observed column remains CGMsum. The MW-reference columns are named model projections; they are not treated as the same kind of data.
| OBSID | 分区Side | Rproj (kpc) | R∥ (kpc) | NH | 观测 CGMsumObserved CGMsum | MW固定NHMW fixed-NH | MW实际HI4PIMW actual HI4PI |
|---|---|---|---|---|---|---|---|
| 800731501 | North/NW | 10.52 | +8.84 | 0.0585 | 0.953 ± 0.126 | 1.296 | 1.272 |
| 800731901 | South/SE | 11.17 | -8.61 | 0.0648 | 0.820 ± 0.605 | 1.264 | 1.185 |
| 800731601 | North/NW | 13.07 | +12.69 | 0.0630 | 0.824 ± 0.094 | 1.289 | 1.225 |
| 800732001 | South/SE | 13.21 | -12.84 | 0.0692 | 0.869 ± 0.244 | 1.275 | 1.158 |
| 800731101 | North/NW | 13.45 | +5.85 | 0.0567 | 0.887 ± 0.632 | 1.312 | 1.305 |
| 800732301 | South/SE | 16.73 | -3.20 | 0.0529 | 0.745 ± 0.561 | 1.243 | 1.271 |
| 800730801 | North/NW | 18.92 | +10.71 | 0.0560 | 0.794 ± 0.435 | 1.321 | 1.322 |
| 800730901 | North/NW | 19.01 | +14.26 | 0.0559 | 0.931 ± 0.121 | 1.313 | 1.314 |
| 800730701 | North/NW | 19.54 | +6.64 | 0.0573 | 0.816 ± 0.175 | 1.329 | 1.317 |
| 800730501 | North/NW | 23.40 | +11.39 | 0.0553 | 1.154 ± 0.141 | 1.334 | 1.341 |
| 800730601 | North/NW | 25.03 | +7.19 | 0.0579 | 1.381 ± 0.187 | 1.344 | 1.325 |
| 800732801 | South/SE | 26.10 | -9.07 | 0.0481 | 0.725 ± 0.319 | 1.225 | 1.298 |
| 800730301 | North/NW | 28.69 | +16.68 | 0.0576 | 0.975 ± 0.123 | 1.343 | 1.327 |
| 800730201 | North/NW | 28.79 | +11.82 | 0.0578 | 1.109 ± 0.137 | 1.351 | 1.333 |
1.255先分别计算North与South的inverse-variance mean,再给两个sides等权,是side-balanced辅助summary。1.290直接对全部14场使用观测inverse-variance weights,并与all-field measured total 0.965配对;新版Figure 3用它作为实心橙色主竖线。它们是不同estimator。
1.255 first computes inverse-variance means within North and South, then weights the two sides equally; it is a side-balanced auxiliary summary. 1.290 applies observational inverse-variance weights to all 14 fields and pairs with the all-field total 0.965; the revised Figure 3 uses it as the solid orange main line. They are different estimators.
不是。它只用published marginal parameter errors做diagonal first-order propagation;Locatelli posterior covariance不可用。因此图中的outer horizontal bar只能叫parameter-sensitivity range,不能叫posterior、confidence或credible interval。
No. It uses published marginal parameter errors in a diagonal first-order propagation without the Locatelli posterior covariance. The outer horizontal bar is a parameter-sensitivity range, not a posterior, confidence, or credible interval.
Ueda+22的75°<l<285°、|b|>15°描述130场parent sample;本页采用的ne0=3.4×10⁻³ cm−3来自Table 3的2005–2009、|l|>105°、N=36 disk row。M31的14场仍在这个selected angular domain内,因此可以沿每条真实视线积分并应用逐场HI4PI。得到的0.312是与观测采用相同inverse-variance weights的条件模型值。绿色inner horizontal bar是14场nominal spread,outer bar仅展开n0边际误差;没有参数covariance,不能叫posterior interval。eFEDS和H&S13只提供其他天空方向的测量分布,不能局部化到M31。
Ueda+22 used a 130-field parent sample over 75°<l<285° and |b|>15°. The ne0=3.4×10⁻³ cm−3 normalization used here comes specifically from the Table 3 2005–2009, |l|>105°, N=36 disk row. All 14 M31 fields remain inside that selected angular domain, so the model can be integrated along each actual sightline and converted with field-specific HI4PI. Its 0.312 value uses the same inverse-variance weights as the observed total. The green inner horizontal bar is nominal footprint spread and the outer bar varies only marginal n0; without parameter covariance this is not a posterior interval. eFEDS and H&S13 instead provide measurements in other sky directions and cannot be localized to M31.
有line catalog,但不能直接变成独立MW broadband prior。X-LEAP I在M31 4.4°内有52条catalog rows,全部被标为M31-contaminated且没有一条属于clean sample;作者还报告约10°–20°的M31-associated enhancement。clean 10°–20°和20°–30° annuli的raw detected O VIII median都约1.41 L.U.,但这是observed line intensity,仍混有方向依赖的SWCX/absorption,也没有MW/M31 component separation。
X-LEAP provides a line catalog, but not an independent MW broadband prior. X-LEAP I has 52 catalog rows within 4.4° of M31; all are flagged as M31-contaminated and none belongs to the clean sample, and the paper reports an M31-associated enhancement over roughly 10°–20°. The clean 10°–20° and 20°–30° annuli both have a raw detected O VIII median near 1.41 L.U., but these are observed line intensities with direction-dependent SWCX/absorption and no MW/M31 component separation.
X-LEAP II的Eq. 3机械代入M31距Galactic center的118.78°得到EM=−0.0011 pc cm−6,但Figure 5和正文在同一角距却约为17–18×10−3,并称负值只在>150°出现;公式、图和正文不闭合,所以不存在唯一可复现的M31原生EM。该文也明确把3D density decomposition留给未来工作。因此X-LEAP只保留为line/temperature context,不加成第六条broadband竖线。
Literal substitution into X-LEAP II Equation 3 gives EM=−0.0011 pc cm−6 at M31's 118.78° separation from the Galactic center, whereas Figure 5 and the text imply roughly 17–18×10−3 there and say negative values appear only beyond 150°. Equation 3 conflicts with Figure 5 and the prose, so there is no unique reproducible native M31 EM. X-LEAP II also leaves the 3D density decomposition to future work; it remains line/temperature context rather than a sixth broadband reference.
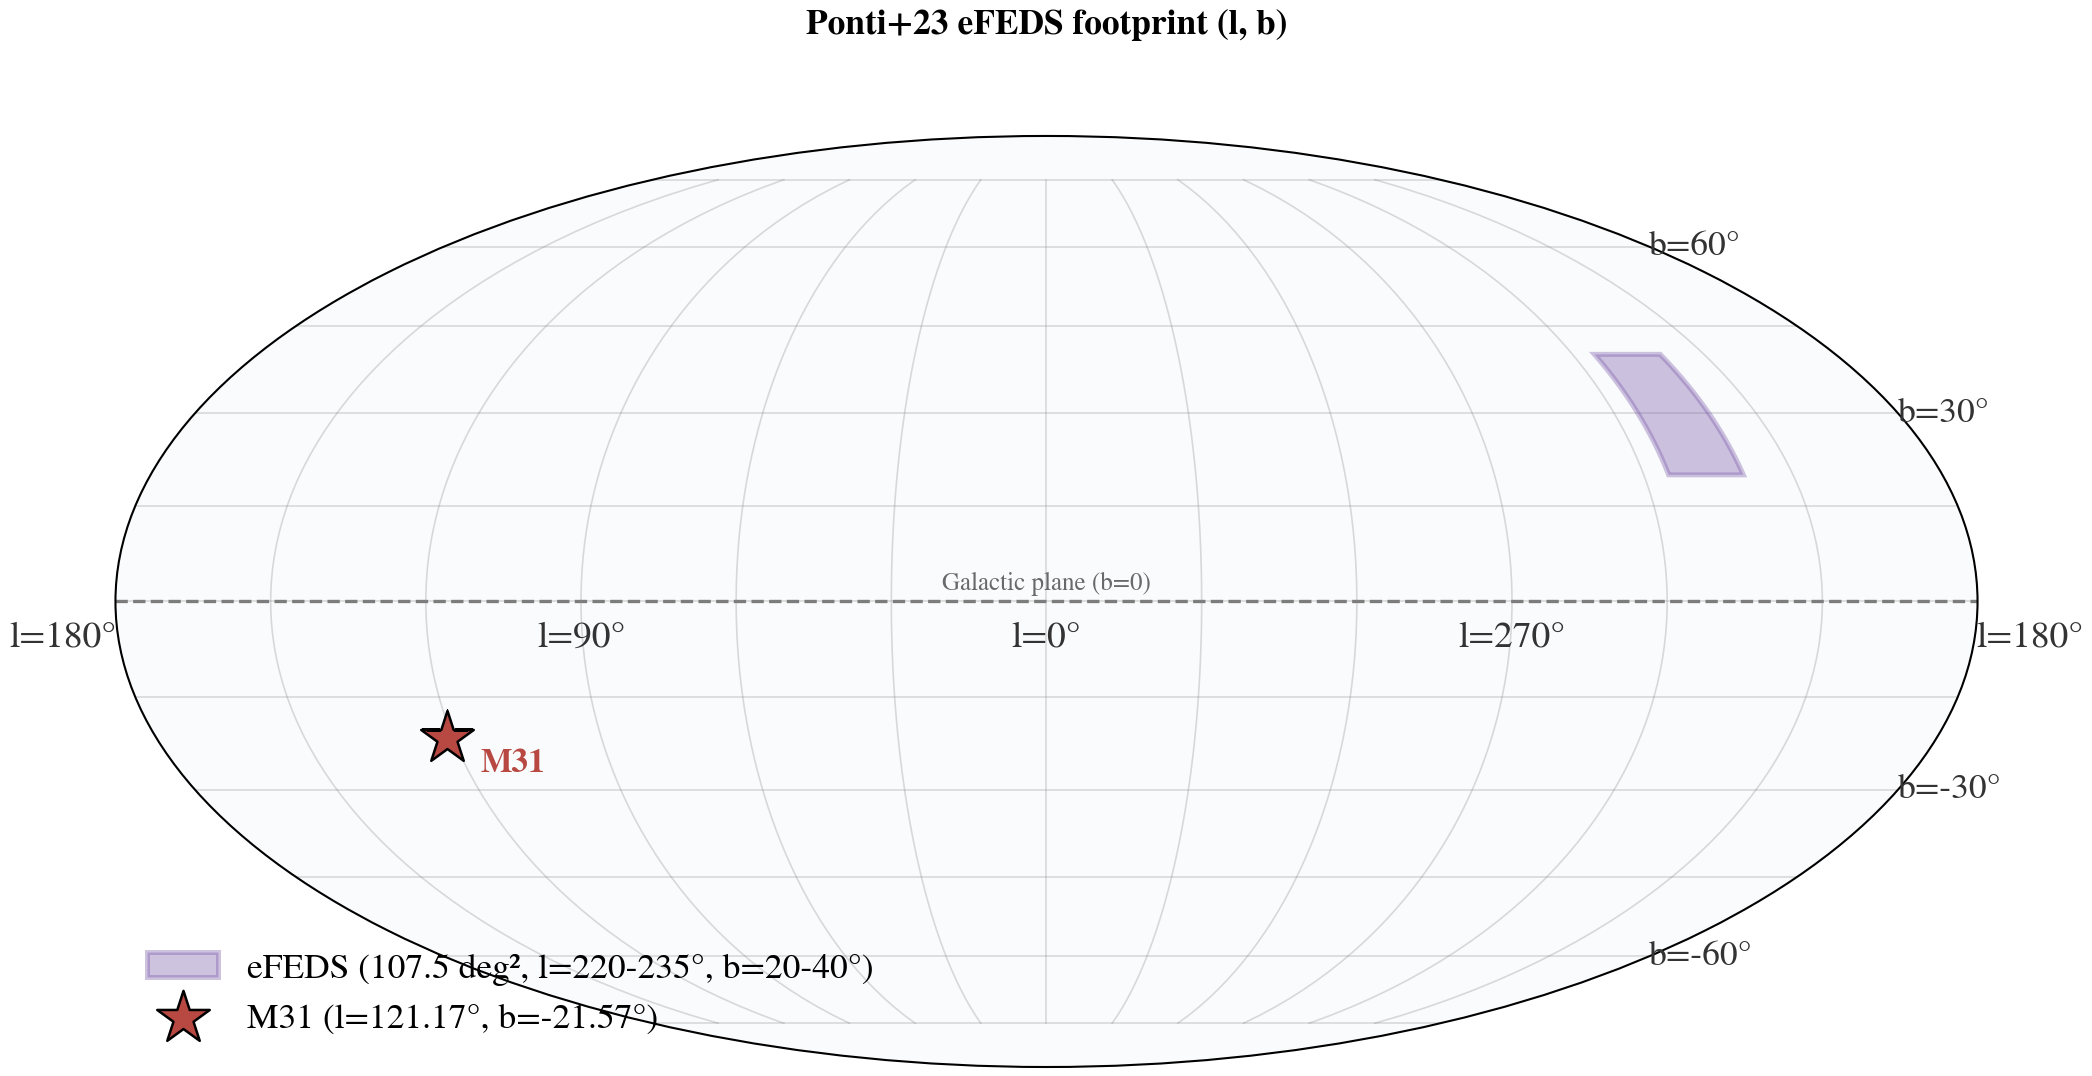
是,但要区分两项结果。Ponti+23在107.5 deg² eFEDS区域发表了可分解的CGM component flux,所以能转换成图中的两条紫色scenario竖线;它离M31至少105°,不是M31同向先验。Yeung+24 Paper I覆盖西半球约2000个spectral bins,但文章主题是Local Hot Bubble,并明确把CGM结果留给Paper II;不能从Paper I虚构一个western-hemisphere broadband CGM分布。
Yes, but two results must be separated. Ponti+23 published a decomposed CGM-component flux for the 107.5 deg² eFEDS field, supporting the two purple vertical scenario lines; it remains at least 105° from M31 and is not M31-matched. Yeung+24 Paper I analyzed roughly 2000 western-hemisphere spectral bins but focused on the Local Hot Bubble and explicitly deferred the CGM results to Paper II. Paper I therefore does not support inventing a western-hemisphere broadband CGM distribution.
08 · what this page does not claim
09 · reproduce every step
所有页面资产进入 SHA-256 manifest。CSV 保存连续 profiles 和逐场 conversion;JSON 保存参数、单位、estimator 和 build metadata。
Every page asset enters a SHA-256 manifest. CSV files preserve continuous profiles and field-level conversions; JSON preserves parameters, units, estimators, and build metadata.
📖 Figure 3 参考文献可执行教程(面向物理系本科一年级):📖 Figure 3 reference executable tutorials (first-year undergrad level):
Build:2026-07-18 18:11 UTC。Canonical URL:m31cgm-mw-m31-profile-explorer.pages.dev。Build: 2026-07-18 18:11 UTC. Canonical URL: m31cgm-mw-m31-profile-explorer.pages.dev.